Figures & data
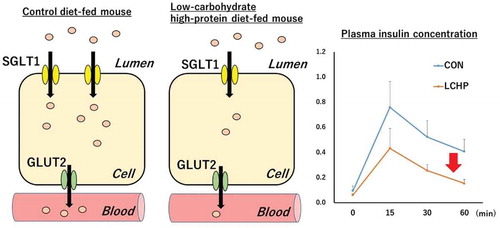
Table 1. Composition of experimental diets.
Table 2. Body weight, food intake and organ weight in mice.
Figure 1. Effects of low-carbohydrate high-protein (LCHP) diet on plasma glucose (a) and insulin (c) levels in mice.
The area under the curve (AUC) values were calculated in accordance with the trapezoidal rule (b, d). Values are means ± SEM, n = 7–8. *p < 0.05 compared to the control (CON) group.
Figure 2. Effects of low-carbohydrate high-protein (LCHP) diet on blood glucose levels (a) in response to insulin administration in mice, and on the GLUT-4 protein concentration (c) and glycogen concentration (d) in the gastrocnemius muscle.
Values are means ± SEM, n = 7–8. A.U., arbitrary unit.
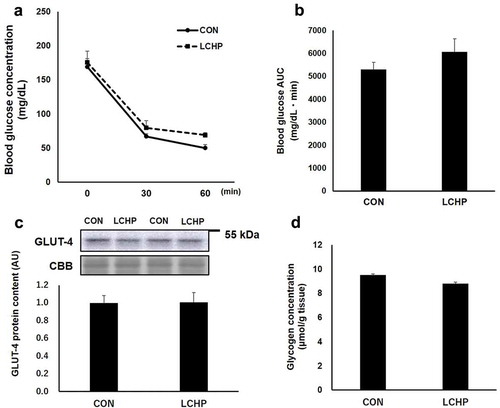
Figure 3. Effects of low-carbohydrate high-protein (LCHP) diet on SGLT-1 (a) and GLUT-2 (b) protein contents in the jejunum of mice.
Values are means ± SEM, n = 7–8. *p < 0.05 compared to the control (CON) group. A.U., arbitrary unit.
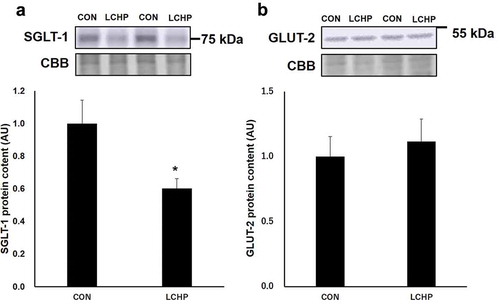
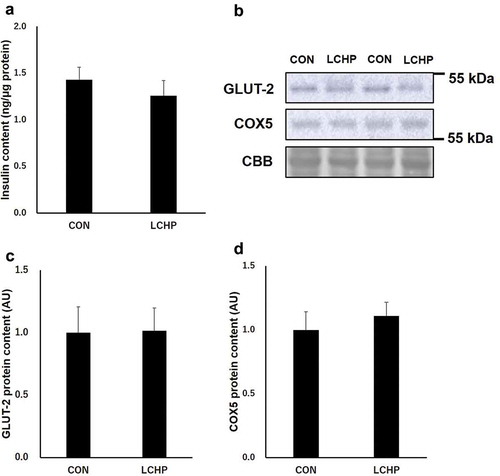
Figure 4. Effects of low-carbohydrate high-protein (LCHP) diet on insulin content (a), representative blots of GLUT-2 and COX5 (b), GLUT-2 (c), and COX5 (d) protein contents in the pancreas of mice.
Values are means ± SEM, n = 7–8. A.U., arbitrary unit.