Figures & data
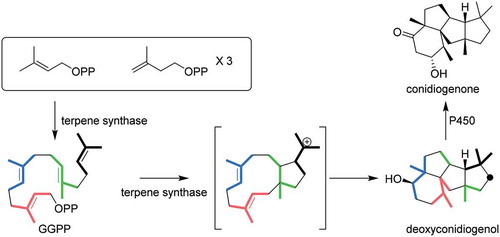
Figure 1. Structures of (−)-conidiogenone (1), conidiogenol, and deoxyconidiogenol (2).
Figure 2. GC-MS and LC-MS profiles of the extracts from enzymatic reaction and heterologous expression.
(a). GC-MS profile of PchDS reaction. Upper panel: chromatogram showing total ion current (TIC). Lower panel: MS spectrum of 2. (b). GC-MS profile of metabolites extracted from AO-PrDS and A. oryzae NSAR1. Upper panel: chromatograms extracted at m/z 290. Lower panel: MS spectrum of 2. (c). LC-MS profile of AO-PrDS and AO-PrDS/PrP450. Chromatograms are extracted at m/z 305.
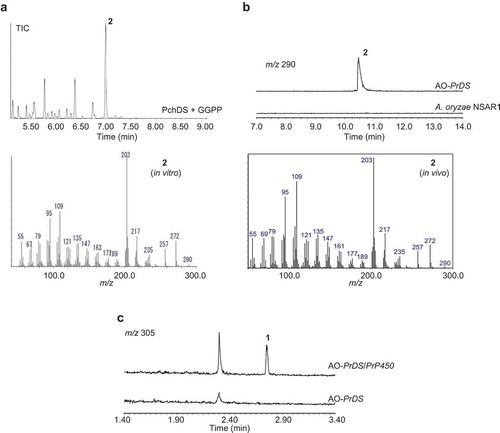
Table 1. 13C chemical shifts and multiplicity of [13C20]-2 (CDCl3, 150 MHz).
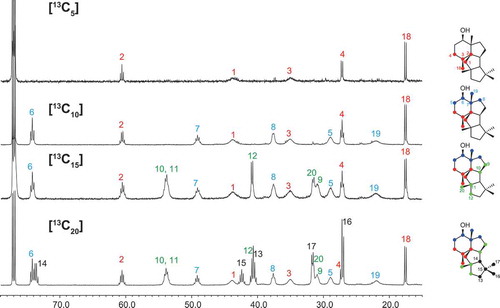
Figure 3. 13C NMR spectra of 13C-labeled 2 enzymatically synthesized by PchDS (CDCl3, 150 MHz).
The solvent signal at δC 77.0 was used as a reference.
Scheme 1. Proposed cyclization mechanism catalyzed by PchDS/PrDS.
The numbers of intermediates are consistent with those in ref. 22.
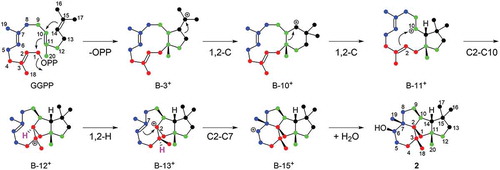
Figure 4. 13C NMR spectra of deoxyconidiogenol (2) measured at room temperature (a, toluene-d8, 125 MHz) and at −80 °C (b, toluene-d8, 150 MHz).
Chemical shifts are referenced to the methyl signal of toluene-d8 (δC 20.4).
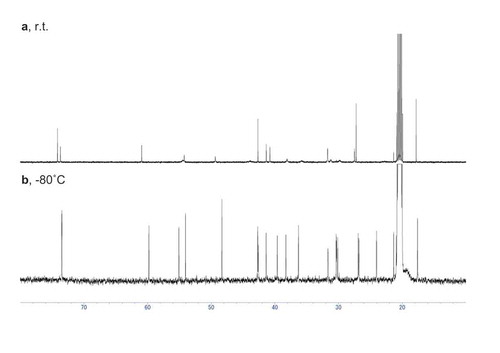
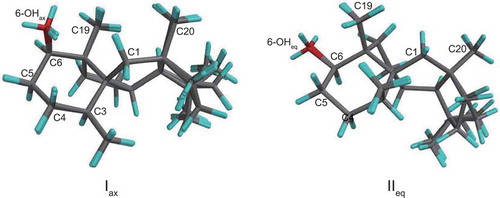
Figure 5. Stereostructures of the two conformers, Iax and IIeq.
M0001-M0006 are superposed for Iax (81% distribution) and M0007 and M0012 are superposed for IIeq (18% distribution).