Figures & data
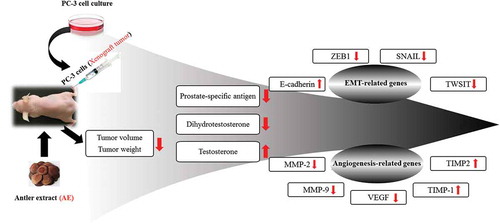
Figure 1. Study scheme of xenograft tumor model.
Normal (phosphate-buffered saline [PBS] 200 μL), control (Con, PBS 200 μL + tumor cells); cisplatin (Cis, 10 mg/kg + tumor cells); antler extract low- and high-dose (AEL and AEH, 200 and 400 mg/kg, respectively plus tumor cells. From day 0, we administered an injection three times a week to Con, Cis, AEL, and AEH groups and waited for 1 week. When xenograft tumor volume was approximately 100 mm3, mice were randomly assigned to four groups and treated accordingly.
![Figure 1. Study scheme of xenograft tumor model.Normal (phosphate-buffered saline [PBS] 200 μL), control (Con, PBS 200 μL + tumor cells); cisplatin (Cis, 10 mg/kg + tumor cells); antler extract low- and high-dose (AEL and AEH, 200 and 400 mg/kg, respectively plus tumor cells. From day 0, we administered an injection three times a week to Con, Cis, AEL, and AEH groups and waited for 1 week. When xenograft tumor volume was approximately 100 mm3, mice were randomly assigned to four groups and treated accordingly.](/cms/asset/fa92646f-9361-4f53-a039-91758bb707f8/tbbb_a_1537775_f0001_b.gif)
Figure 2. Effect of antler extract (AE) on food intake, body weight, and tumor volume.
Normal (phosphate-buffered saline [PBS] 200 μL), control (Con, PBS 200 μL + tumor cells); cisplatin (Cis, 10 mg/kg + tumor cells); antler extract low- and high-dose (AEL and AEH, 200 and 400 mg/kg, respectively plus tumor cells. (a) Food weight, (b) body weight, (c) tumor volume, (d) AE treatment of prostate cancer (PC) xenograft model image, (e and f) Tumor image and weight. a, b, c and d Means with different superscript in the same row are different (p < 0.05).
![Figure 2. Effect of antler extract (AE) on food intake, body weight, and tumor volume.Normal (phosphate-buffered saline [PBS] 200 μL), control (Con, PBS 200 μL + tumor cells); cisplatin (Cis, 10 mg/kg + tumor cells); antler extract low- and high-dose (AEL and AEH, 200 and 400 mg/kg, respectively plus tumor cells. (a) Food weight, (b) body weight, (c) tumor volume, (d) AE treatment of prostate cancer (PC) xenograft model image, (e and f) Tumor image and weight. a, b, c and d Means with different superscript in the same row are different (p < 0.05).](/cms/asset/d367cd61-ec46-4eaa-90c0-cc5b08ac371a/tbbb_a_1537775_f0002_oc.jpg)
Figure 3. Effect of antler extract (AE) on prostate-specific antigen (PSA), dihydrotestosterone (DHT), and testosterone levels in prostate cancer (PC) xenograft model.
(a) Serum PSA, (b) DHT, and (c) testosterone changes in treated and untreated nude mice. Normal (phosphate-buffered saline [PBS] 200 μL), control (Con, PBS 200 μL + tumor cells); cisplatin (Cis, 10 mg/kg + tumor cells); antler extract low- and high-dose (AEL and AEH, 200 and 400 mg/kg, respectively plus tumor cells. a, b, c and d Means with different superscript in the same row are different (p < 0.05).
![Figure 3. Effect of antler extract (AE) on prostate-specific antigen (PSA), dihydrotestosterone (DHT), and testosterone levels in prostate cancer (PC) xenograft model.(a) Serum PSA, (b) DHT, and (c) testosterone changes in treated and untreated nude mice. Normal (phosphate-buffered saline [PBS] 200 μL), control (Con, PBS 200 μL + tumor cells); cisplatin (Cis, 10 mg/kg + tumor cells); antler extract low- and high-dose (AEL and AEH, 200 and 400 mg/kg, respectively plus tumor cells. a, b, c and d Means with different superscript in the same row are different (p < 0.05).](/cms/asset/2a126e0b-3c43-41da-b049-011f95ad3aff/tbbb_a_1537775_f0003_b.gif)
Figure 4. Effect of antler extract (AE) on angiogenesis-related gene expression in tumor tissue.
Control (Con, PBS 200 μL + tumor cells); cisplatin (Cis, 10 mg/kg + tumor cells); antler extract low- and high-dose (AEL and AEH, 200 and 400 mg/kg, respectively plus tumor cells. β-actin was loading control. Blot represents mean of three individual experiments performed in triplicate. *Significant difference from the Con group shown at p < 0.05.
Figure 5. Effect of antler extract (AE) on epithelial to mesenchymal transition (EMT)-related gene expression in tumor tissue.
Control (Con, PBS 200 μL + tumor cells); cisplatin (Cis, 10 mg/kg + tumor cells); antler extract low- and high-dose (AEL and AEH, 200 and 400 mg/kg, respectively plus tumor cells. β-Actin was a loading control. Blot represents mean of three individual experiments performed in triplicate. *Significant difference from the Con group shown at p < 0.05.