Figures & data
Table 1. Clinicopathological characteristics in NSCLC patients (n = 30).
Figure 1. Low miR-5195-3p expression was found in NSCLC tissues and cell lines. (a) miR-5195-3p expression in 30 pairs of NSCLC tissues was determined using quantitative real-time PCR assays, compared with the adjacent tissues. (b) miR-5195-3p expression in NSCLC cell lines H1299, 95D, H1650, SPC-A1, and A549, and normal cell line BEAS-2B using quantitative real-time PCR assay. The data are presented as the mean ± standard deviation of three independent experiments. **p < 0.01, ***p < 0.001 vs. BEAS-2B; NSCLC, non-small cell lung cancer.
Figure 2. MiR-5195-3p inversely regulates MYO6 expression through direct binding to its 3ʹUTR. (a) Complementary sequences between miR-5195-3p and the 3ʹ-UTR of MYO6 mRNA were obtained using publicly available algorithms. The mutated version of the MYO6 3ʹ-UTR is also shown. The relative luciferase activities were inhibited in (b) 95D and (c) A549 cells co-transfected with wild-type MYO6 3ʹUTR vector and miR-5195-3p, not with the mutant-type vector. Firefly luciferase activity was normalized to Renilla luciferase. Data are presented as the mean value ± SD from triplicate experiments. **p < 0.01 vs. miR-NC; Western blot analysis was performed to determine the protein level of MYO6 in (d) 95D and (e) A549 cells transfected with miR-5195-3p or miR-NC. (f) The relative expression levels of MYO6 mRNA in NSCLC tissues and adjacent tissues were detected by quantitative real time PCR. (g) The Pearson’s correlation analysis for the correlation between miR-5195-3p levels and MYO6 mRNA in NSCLC tissues.
Figure 3. Functions of miR-5195-3p overexpression in the regulation of NSCLC cell proliferation, migration and invasion. 95D and A549 cells were transfected with miR-5195-3p or miR-NC, respectively. (a) Quantitative real time PCR was used to analyze the expression levels of miR-5195-3p. (b) Cell proliferation was measured by CCK-8 assay. (c) The cell migration and (d) invasion capability of 95D and A549 cells was determined using Transwell assays. Data are presented as the mean value ± SD from triplicate experiments. ***p < 0.001 vs. miR-NC.
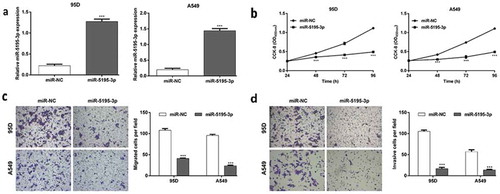
Figure 4. Functions of MYO6 knockdown in the regulation of NSCLC cell proliferation, migration and invasion. 95D and A549 cells were transfected with siMYO6 or siNC, respectively. (a) Western blot analysis was performed to analyze the protein level of MYO6. (b) Cell proliferation was evaluated by CCK-8 assay. (c) The cell migration and (d) invasion capability of 95D and A549 cells was measured using Transwell assays. Data are presented as the mean value ± SD from triplicate experiments. ***p < 0.001 vs. siNC.
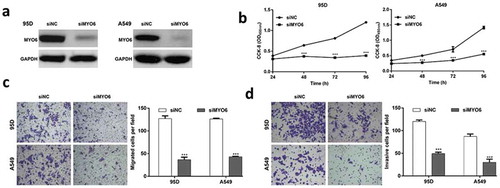
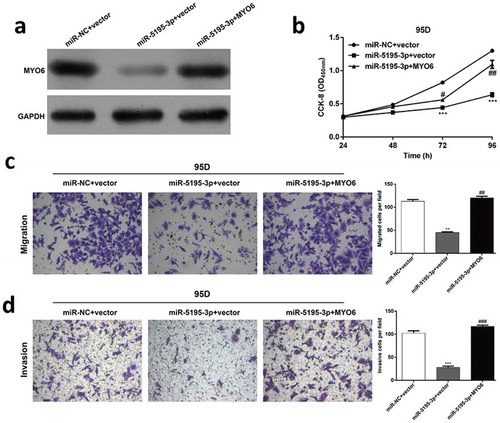
Figure 5. MYO6 overexpression can partially rescue the effects of miR-5195-3p in NSCLC. Transfected 95D cells were divided into three groups, including miR-NC + vector, miR-5195-3p + vector, and miR-5195-3p + MYO6. (a) Western blot analysis was performed to analyze the protein level of MYO6. (b) Cell proliferation was measured by the CCK-8 assay. The CCK-8 assay was performed every 24 hours for 4 days. (c) The cell migration and (d) invasion capability of 95D. Data are presented as the mean value ± SD from triplicate experiments. **p < 0.01, ***p < 0.001 vs. miR-NC + vector, #p < 0.05, ##p < 0.01 vs. miR-5195-3p + vector.