Figures & data
Scheme 1.
Table 1. Data collection and refinement statistics for PnGGT structures.
Table 2. Overlapping complementary primers for the site-directed mutagenesis.
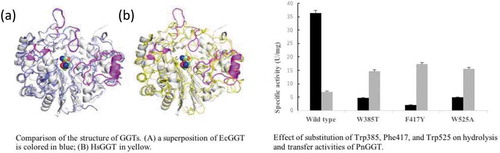
Figure 1. Comparison of the structure of GGTs. PnGGT is colored in white and the ligands bound in the active site are represented with a space-filling model.
(a) a superposition of EcGGT is colored in blue; (b) HsGGT in yellow. The regions with major difference in PnGGT chain are represented in magenta.
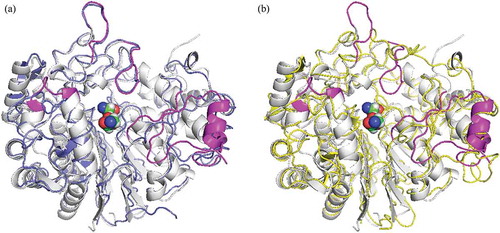
Figure 2. Local structures of substrate binding sites.
(a) Gly and Gly-Gly-bound PnGGT at 1.70 Å resolution. SIGMAA-weighted (Fo-Fc) omit maps for Gly and Gly-Gly (green). These maps are contoured at 3 σ. Ligands and major residues in the active site are drawn as stick models, and the protein is drawn as a line model. Hydrogen bonds are shown in a dashed line. (b) Comparison between the active site structures of PnGGT (pink), EcGGT (blue), and HsGGT (yellow). (c) Schematic diagrams of protein-ligand interactions for a) Gly and GlyGly in the PDB entry 5ZJB, b) peptidyl phosphonate inhibitor in the PDB entry 5B5T, and c) Glu in the PDB entry 5ZCG.
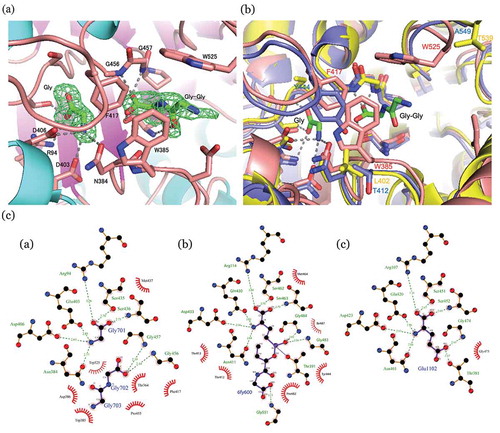
Figure 3. Multiple sequence alignment of GGTs from Pseudomonas nitroreducens, Escherichia coli and human.
Arrows indicate three aromatic amino acids, Trp385, Phe417, and Trp525. Identical amino acid residues are highlighted by black background. Similar amino acid residues are highlighted by gray background.
Figure 4. Effect of substitution of Trp385, Phe417, and Trp525 on hydrolysis and transfer activity of PnGGT.
Black and gray bars represent the specific activity of ϒ-glutamyl-p-nitroanilide hydrolysis and ϒ-L-glutamylhydroxamate synthesis, respectively.