Figures & data
Figure 1. LPS induces autophagy in BV-2 cells. (a) GFP-LC3 puncta were observed in GFP-LC3 expressing BV-2 cells treated with LPS (1μg/mL) for the indicated times (0, 6, and 12 h) using a fluorescence microscope. Scale bars represent 200 μm. (b) Graph showing number of GFP-LC3 puncta per cell. (c) Western blot analysis of p62, LC3B, Beclin1, iNOS, and Cox-2 in LPS treated BV-2 cells for 6 and 12 h. (d) Graphs represent quantification of western blot band intensity. (e) Western blot analysis to measure autophagic flux. LPS stimulated BV-2 cells were treated 4h before the cell harvest with chloroquine (100μM). (f) Graphs represent quantification of western blot band intensity. (b), (d) and (f) used one way ANOVA statistical analysis. Data are presented as mean ± SD (n = 3). *p < 0.05, **p < 0.01, and ***p < 0.001.
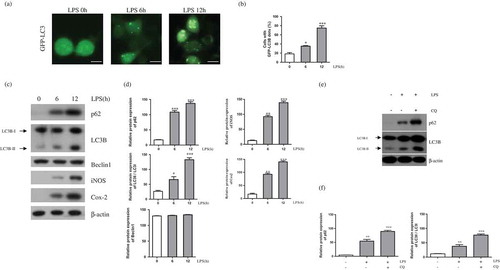
Figure 2. Effect of LPS-induced mitochondrial fission on autophagy. (a) BV-2 cells were treated with LPS (1μg/mL) for 12h in the absence or presence of Mdivi-1 (25μM). The cells were incubated with MitoSOX and JC-1 for 15min at 37℃ and mitochondrial ROS and membrane potentials were analyzed by flow cytometry. (b) GFP-LC3B puncta were observed in GFP-LC3 expressing BV-2 cells treated with LPS for indicated times, in the presence or absence of Mdivi-1 using a fluorescence microscope. Scale bars represent 200 μm. (c) Graph indicates numbers of GFP-LC3 puncta per cell. (d) p62, LC3B, and Beclin1 expression in LPS-treated BV-2 cells with or without Mdivi-1 pre-treatment was determined using western blotting. (e) Graphs represent quantification of western blot band intensity. (f) Western blot analysis to measure authphagic flux. LPS stimulated BV-2 cells were treated 4h before the cell harvest with chloroquine (100μM) in the absence or presence of Mdivi-1. (g) Graphs represent quantification of western blot band intensity. (a), (g) used one way ANOVA and (c), (e) used two way ANOVA statistical analysis. Data are presented as mean ± SD (n = 3). *p < 0.05, **p < 0.01, and ***p < 0.001.
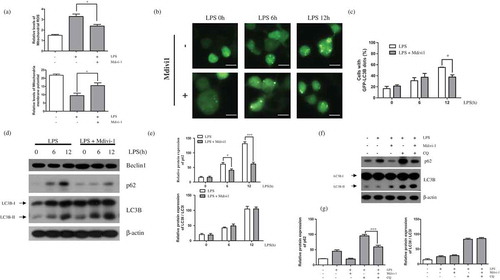
Figure 3. Effect of Drp1 downregulation on LPS-induced autophagy. (a) BV-2 cells were treated with LPS (1μg/mL) for 12h in the absence or presence of Drp1. The cells were incubated with MitoSOX and JC-1 for 15min at 37℃ and mitochondrial ROS and membrane potentials were analyzed by flow cytometry. (b) Western blotting for p62 and LC3B was performed in LPS treated BV-2 cells expressing either scrambled shRNA (scram) or shDrp1 expressing BV2 cells. (c) Graphs represent quantification of western blot band intensity. (d) Western blot analysis to measure authphagic flux. LPS stimulated BV-2 cells were treated 4h before the cell harvest with chloroquine (100μM) in the absence or presence of Drp1. (e) Graphs represent quantification of western blot band intensity. (a) was used one way ANOVA and (c), (e) was used two way ANOVA statistical analysis. Data are presented as mean ± SD (n = 3). *p < 0.05, **p < 0.01, and ***p < 0.001.
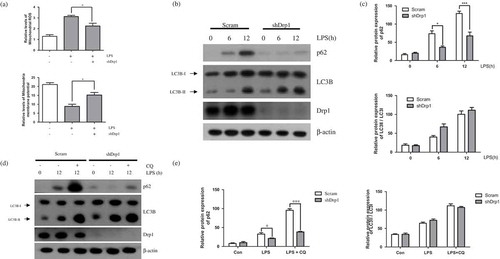
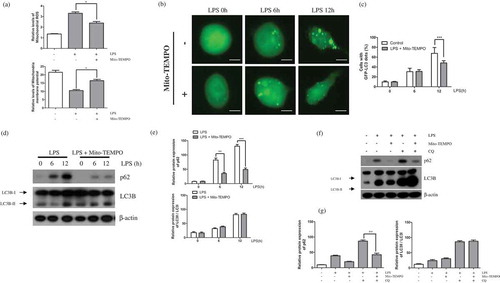
Figure 4. Mitochondrial ROS affects LPS-induced autophagy. (a) BV-2 cells were treated with LPS (1μg/mL) for 12h in the absence or presence of Mito-TEMPO (200μM). The cells were incubated with MitoSOX and JC-1 for 15min at 37℃ and mitochondrial ROS and membrane potentials were analyzed by flow cytometry. (b) The effect of mitochondrial ROS on GFP-LC3 puncta formation was addressed using GFP-LC3-expressing BV-2 cells treated with LPS for indicated times in the presence or absence of Mito-TEMPO using a fluorescence microscope. Scale bars represent 200 μm. (c) Graph represents number of GFP-puncta per cell. (d) Western blot analysis of p62, LC3B, and Beclin1 expression in LPS-treated BV-2 cells in the presence or absence of Mito-TEMPO. (e) Graphs represent quantification of western blot band intensity. (f) Western blot analysis to measure authphagic flux. LPS stimulated BV-2 cells were treated 4h before the cell harvest with chloroquine (100μM) in the absence or presence of Mito-TEMPO. (g) Graphs represent quantification of western blot band intensity. (a), (g) was used one way ANOVA and (c), (e) was used two way ANOVA statistical analysis. Data are presented as mean ± SD (n = 3). *p < 0.05, **p < 0.01, and ***p < 0.001.