646
Views
12
CrossRef citations to date
0
Altmetric
Food & Nutrition Science

Supplemental feeding of phospholipid-enriched alkyl phospholipid from krill relieves spontaneous atopic dermatitis and strengthens skin intercellular lipid barriers in NC/Nga mice

, , , , &
Pages 717-727 | Received 18 Sep 2018, Accepted 03 Dec 2018, Published online: 20 Dec 2018

Figures & data

Table 1. Composition of test lipids (a) and molecular species at the sn-2 position of krill alkylphospholipid (b).

Table 2. Composition of test diets.

Table 3. Growth parameters and plasma lipids (cholesterol, triglyceride, free fatty acid) in NC/Nga mice fed test diets for 5 weeks (Experiment 2).a

Figure 1. Inflammation scores for NC/Nga mice fed test diets for 3 weeks in Experiment 1. Test diets were standard (for control), Alk, and FO. Values are means (n = 7 mice per group), with their standard errors represented by vertical bars. Different superscript letters indicate significant differences at P < 0.05. (a) Plasma IgE; (b) scratch frequency; (c) TEWL; (d) ear thickness.
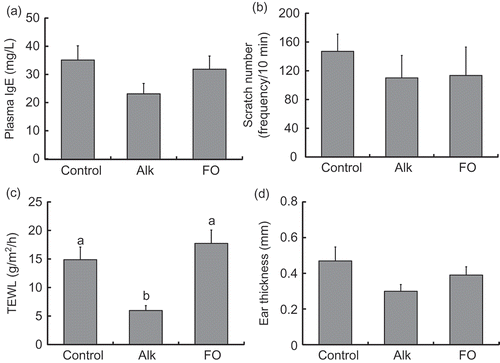
Figure 1. Inflammation scores for NC/Nga mice fed test diets for 3 weeks in Experiment 1. Test diets were standard (for control), Alk, and FO. Values are means (n = 7 mice per group), with their standard errors represented by vertical bars. Different superscript letters indicate significant differences at P < 0.05. (a) Plasma IgE; (b) scratch frequency; (c) TEWL; (d) ear thickness.
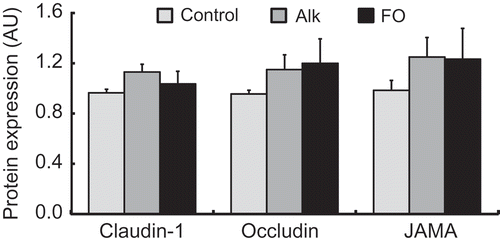
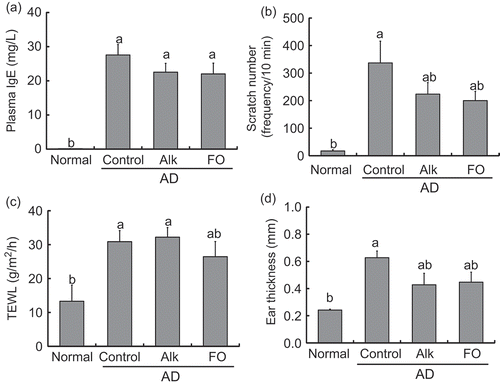
Figure 2. Immunoblot analysis of TJ proteins in the dorsal skin in NC/Nga mice fed test diets for 3 weeks in Experiment 1. Test diets were standard (for control), Alk, and FO. Values are means (n = 7 mice per group), with their standard errors represented by vertical bars. Different superscript letters indicate significant differences at P < 0.05.

Figure 2. Immunoblot analysis of TJ proteins in the dorsal skin in NC/Nga mice fed test diets for 3 weeks in Experiment 1. Test diets were standard (for control), Alk, and FO. Values are means (n = 7 mice per group), with their standard errors represented by vertical bars. Different superscript letters indicate significant differences at P < 0.05.

Figure 3. Inflammation scores for NC/Nga mice fed test diets for 5 weeks in Experiment 2. Test diets were standard diet (for normal and control), Alk, and FO. Normal is non-onset AD, and others are AD induced by infection with M. musculi. Values are means (n = 6–8 mice per group), with their standard errors represented by vertical bars. Different superscript letters indicate significant differences at P < 0.05. (a) Plasma IgE; (b) scratch frequency; (c) TEWL; (d) ear thickness.

Figure 3. Inflammation scores for NC/Nga mice fed test diets for 5 weeks in Experiment 2. Test diets were standard diet (for normal and control), Alk, and FO. Normal is non-onset AD, and others are AD induced by infection with M. musculi. Values are means (n = 6–8 mice per group), with their standard errors represented by vertical bars. Different superscript letters indicate significant differences at P < 0.05. (a) Plasma IgE; (b) scratch frequency; (c) TEWL; (d) ear thickness.

Table 4. Plasma plasmalogen-related parameters and total phospholipid concentration in NC/Nga mice fed test diets for 5 weeks (Experiment 2).a

Figure 4. Plasmalogen and alkyl phospholipid concentration in plasma of NC/Nga mice fed test diets for 5 weeks in Experiment 2. Test diets were standard diet (for normal and control), Alk, and FO. Normal is non-onset AD, and others are AD induced by infection with M. musculi. Values are means (n = 6–8 mice per group), with their standard errors represented by vertical bars. Different superscript letters indicate significant differences at P < 0.05. AlkCho: choline alkylphospholipids; AlkEtn: ethanolamine alkylphospholipids; PlsEtn: ethanolamine plasmalogen; PlsCho: choline plasmalogen.
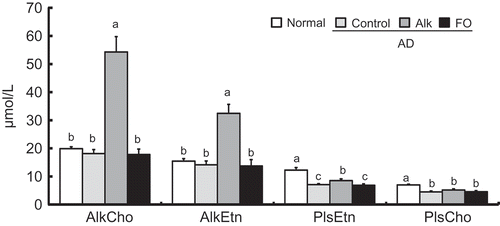
Figure 4. Plasmalogen and alkyl phospholipid concentration in plasma of NC/Nga mice fed test diets for 5 weeks in Experiment 2. Test diets were standard diet (for normal and control), Alk, and FO. Normal is non-onset AD, and others are AD induced by infection with M. musculi. Values are means (n = 6–8 mice per group), with their standard errors represented by vertical bars. Different superscript letters indicate significant differences at P < 0.05. AlkCho: choline alkylphospholipids; AlkEtn: ethanolamine alkylphospholipids; PlsEtn: ethanolamine plasmalogen; PlsCho: choline plasmalogen.
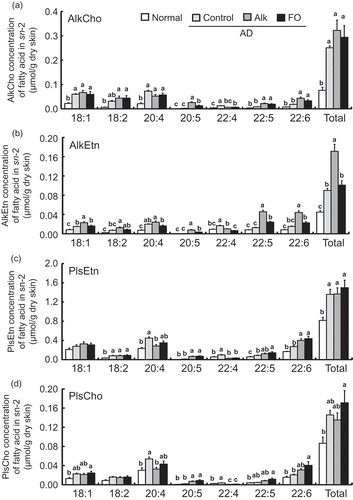
Figure 5. Distribution of molecular species at the sn-2 position of (a) choline alkylphospholipid (AlkCho), (b) ethanolamine alkylphospholipid (AlkEtn), (c) ethanolamine plasmalogen (PlsEtn), and (d) choline plasmalogen (PlsCho) in the dorsal skin of NC/Nga mice fed test diets for 5 weeks in Experiment 2. Test diets were standard diet (for normal and control), Alk, and FO. Normal is non-onset AD, and others are AD induced by infection with M. musculi. Values represent skin concentrations of FAs at the sn-2 position of individual ether glycerophospholipids and are means (n = 6–8 mice per group), with their standard errors represented by vertical bars. Different superscript letters indicate significant differences at P < 0.05.
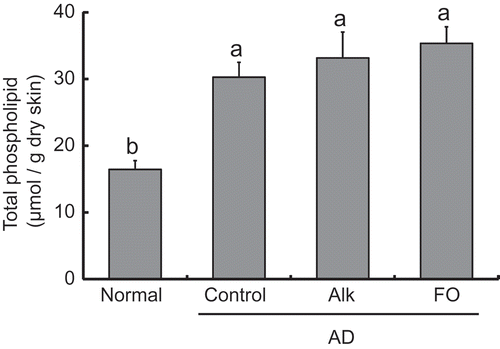
Figure 5. Distribution of molecular species at the sn-2 position of (a) choline alkylphospholipid (AlkCho), (b) ethanolamine alkylphospholipid (AlkEtn), (c) ethanolamine plasmalogen (PlsEtn), and (d) choline plasmalogen (PlsCho) in the dorsal skin of NC/Nga mice fed test diets for 5 weeks in Experiment 2. Test diets were standard diet (for normal and control), Alk, and FO. Normal is non-onset AD, and others are AD induced by infection with M. musculi. Values represent skin concentrations of FAs at the sn-2 position of individual ether glycerophospholipids and are means (n = 6–8 mice per group), with their standard errors represented by vertical bars. Different superscript letters indicate significant differences at P < 0.05.

Figure 6. Total phospholipid concentration in the dorsal skin of NC/Nga mice fed test diets for 5 weeks in Experiment 2. Test diets were standard diet (for normal and control), Alk, and FO. Normal is non-onset AD, and others are AD induced by infection with M. musculi. Values are means (n = 6–8 mice per group), with their standard errors represented by vertical bars. Different superscript letters indicate significant differences at P < 0.05.

Figure 6. Total phospholipid concentration in the dorsal skin of NC/Nga mice fed test diets for 5 weeks in Experiment 2. Test diets were standard diet (for normal and control), Alk, and FO. Normal is non-onset AD, and others are AD induced by infection with M. musculi. Values are means (n = 6–8 mice per group), with their standard errors represented by vertical bars. Different superscript letters indicate significant differences at P < 0.05.

Figure 7. Levels of intercellular lipid in the dorsal skin of NC/Nga mice fed test diets for 5 weeks in Experiment 2. Test diets were standard diet (for normal and control), Alk, and FO. Normal is non-onset AD, and others are AD induced by infection with M. musculi. Values are means (n = 6–8 mice per group), with their standard errors represented by vertical bars. Different superscript letters indicate significant differences at P< 0.05. (a) Total cholesterol; (b) FFA; (c) non-hydroxyceramide; (d) hydroxyceramide.
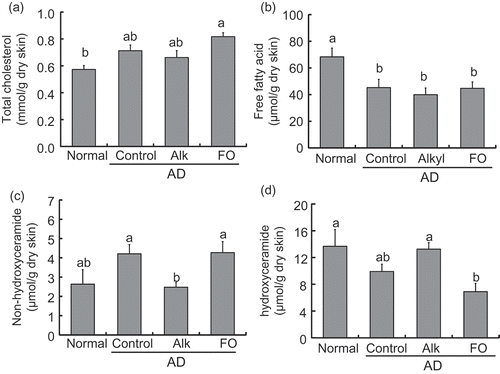
Figure 7. Levels of intercellular lipid in the dorsal skin of NC/Nga mice fed test diets for 5 weeks in Experiment 2. Test diets were standard diet (for normal and control), Alk, and FO. Normal is non-onset AD, and others are AD induced by infection with M. musculi. Values are means (n = 6–8 mice per group), with their standard errors represented by vertical bars. Different superscript letters indicate significant differences at P< 0.05. (a) Total cholesterol; (b) FFA; (c) non-hydroxyceramide; (d) hydroxyceramide.

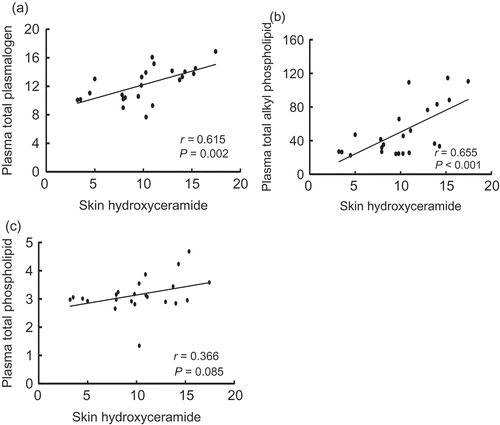
Figure 8. The relationship between levels of skin hydroxyceramide and total plasmalogens (a), total alkyl phospholipid (b), and total phospholipid (c) in the plasma of NC/Nga mice fed test diets for 5 weeks in Experiment 2. Values (r) represent Pearson’s product–moment correlation coefficient.

Figure 8. The relationship between levels of skin hydroxyceramide and total plasmalogens (a), total alkyl phospholipid (b), and total phospholipid (c) in the plasma of NC/Nga mice fed test diets for 5 weeks in Experiment 2. Values (r) represent Pearson’s product–moment correlation coefficient.
Supplemental material

20181206_Supplemental_Fig__Megumi_Nishimukai__for_BBB-h.pptx

Download MS Power Point (179.6 KB)

Reprints and Corporate Permissions

Please note: Selecting permissions does not provide access to the full text of the article, please see our help page How do I view content?

To request a reprint or corporate permissions for this article, please click on the relevant link below:

Academic Permissions

Please note: Selecting permissions does not provide access to the full text of the article, please see our help page How do I view content?

Obtain permissions instantly via Rightslink by clicking on the button below:

If you are unable to obtain permissions via Rightslink, please complete and submit this Permissions form. For more information, please visit our Permissions help page.