Figures & data
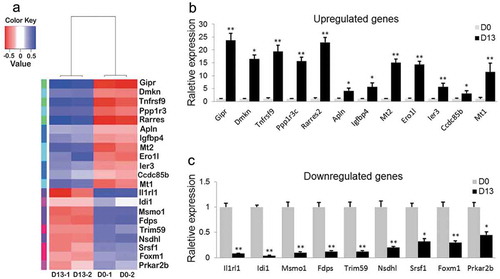
Figure 1. Adipogenesis of 3T3-L1 in vitro.
(a) Oil red O staining. After inducing differentiation of 3T3-L1 preadipocytes, cells were stained with Oil Red O at D0 and D13, respectively. (b) Relative expression level of adipogenic marker genes were detected at D0 and D13 by qRT-PCR. (**p < 0.01. β-actin mRNA was used as control).
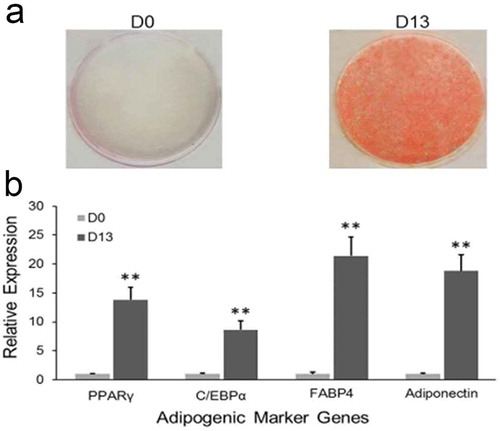
Figure 2. RNA-Seq analysis.
(a) Validation of the transcriptome data. The performance of RNA-Seq was evaluated by determining the correlation of genes expression between two independent samples from preadipocytes (D0-1 and D0-2) or differentiated adipocytes (D13-1 and D13-2). (b) Mapping result statistics at D0 and D13. (c) Pie charts representing the percentage of nucleotide bases mapping to indicated genomic regions.
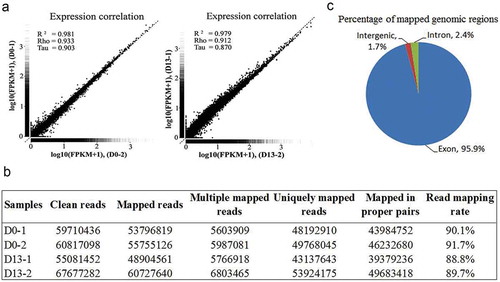
Figure 3. DEGs by RNA-Seq.
(a) Clustering DEGs at D0 and D13. (b) Number of DEGs for D0 vs. D13. (c) Hierarchical clustering of gene expression data shows distinguishable gene expression profiles between preadipocytes (D0-1 and D0-2) and differentiated adipocytes (D13-1 and D13-2).
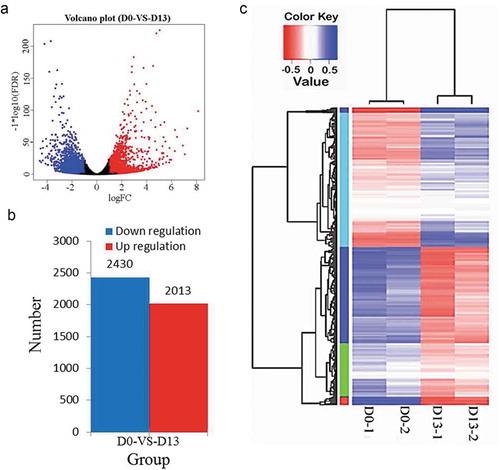
Table 1. Gene ontology analysis of DEGs involved in adipogenesis-associated categories.
Figure 4. Functional enrichment analysis of DEGs.
(a) GO analysis of DEGs. The figure is composed of three parts: molecular functions, cellular components and biological process. The significance level of enrichment was set at corrected p-value (p-value < 0.05). (b) KEGG pathway analysis of differentially expressed genes. Advanced bubble chart shows enrichment of DEGs in signaling pathways. Y-axis label represents pathway, and X-axis label represents rich factor (rich factor = amount of DEGs enriched in the pathway/amount of all genes in background gene set). Size and color of the bubble represent amount of DEGs enriched in pathway and enrichment significance, respectively.
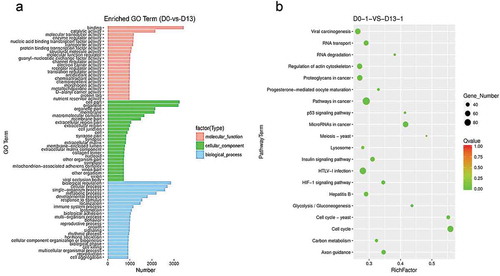
Figure 5. Relative expression levels of 21 DEGs.
(a) Heatmap of 21 DEGs during adipogenesis (p < 0.05). (b) 12 DEGs were validated as significantly upregulated. (c) 9 DEGs were confirmed as significantly downregulated. (*p < 0.05; **p < 0.01. β-actin mRNA was used as control).
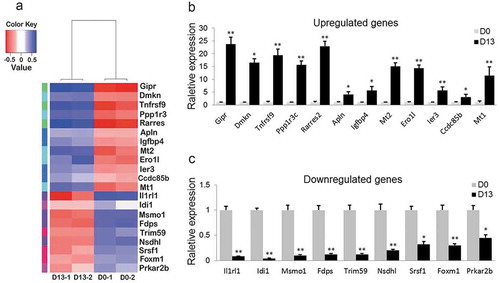
Figure 6. Overexpression of MSMO1 inhibits adipogenesis of 3T3-L1.
3T3-L1 preadipocytes were transfected with pCMV-MSMO1 and were differentiated in differentiation medium for 12 days. (a) Expression of MSMO1 during differentiation of 3T3-L1 at the indicated times by qRT-PCR. (**P < 0.01 vs. D0. β-actin mRNA was used as control). (b) MSMO1 expression was determined in MSMO1-transfected 3T3-L1 preadipocytes by qRT-PCR (after transfected 24 h) and western blot (after transfected 48 h). (**P < 0.01 vs. control vector. β-actin mRNA and tubulin were used as control). (c) Adipocyte differentiation was assessed by Oil Red O staining and expression of PPARγ, FABP4 and C/EBPα on D12. Scale bar indicates 100 µm. (*P < 0.05 vs. control vector. β-actin mRNA was used as control).
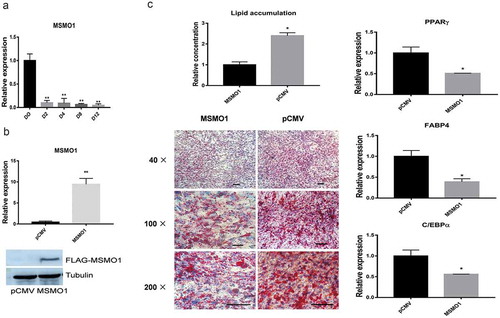
Figure 7. Knockdown of MSMO1 stimulates adipogenesis of 3T3-L1. 3T3-L1 preadipocytes were transfected with MSMO1 siRNA and were differentiated in differentiation medium for 12 days.
(a) MSMO1 knockdown was confirmed in MSMO1 siRNA-transfected 3T3-L1 preadipocytes by qRT-PCR after transfected 24 h. (*P < 0.05 vs. scramble. β-actin mRNA was used as control). (b) Adipogenesis was assessed by Oil Red O staining. Scale bar indicates 100 µm. (**P < 0.01 vs. scramble). (c) The expression of PPARγ, FABP4 and C/EBPα on D12. (*P < 0.05, **P < 0.01 vs. scramble. β-actin mRNA was used as control).
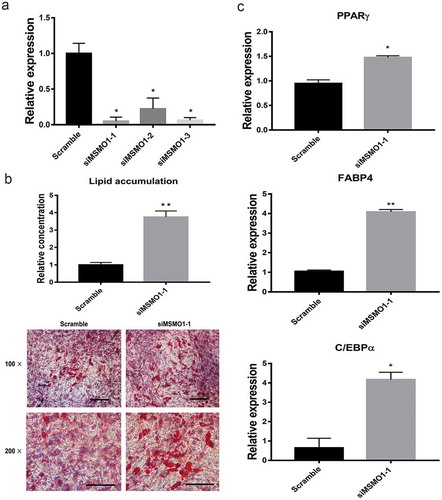
Figure 8. Protein-protein interaction analysis.
Node represents protein; edge represents interaction between proteins; size of the node is proportional to degree of this node (degree of the node is defined as amount of proteins that interact with this node). For interpretation of the references to color in this figure legend. (a) Protein-protein interaction network of differentially expressed genes. Showing 20 related genes, with 38 total genes, and 542 total links. (b) Protein-protein interaction network between MSMO1 and eligible molecules. Showing 20 related genes, with 21 total genes, and 875 total links.
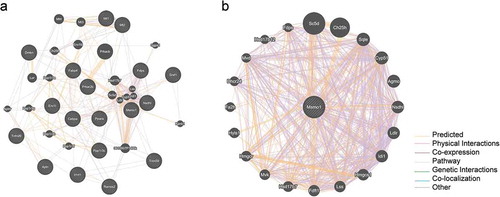
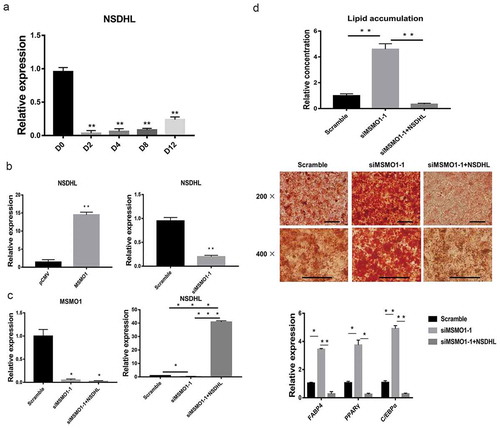
Figure 9. Interaction between MSMO1 and NSDHL.
(a) 3T3-L1 preadipocytes were differentiated in differentiation medium for 12 days and the expression of NSDHL was determined at the indicated times by qRT-PCR. (**P < 0.01 vs. D0. β-actin mRNA was used as control). (b) NSDHL expression was determined in pCMV-MSMO1 or MSMO1 siRNA transfected 3T3-L1 preadipocytes by qRT-PCR after transfected 24 h. (**P < 0.01 vs. control vector or scramble. β-actin mRNA was used as control). (c) 3T3-L1 preadipocytes were differentiated in differentiation medium for 9 days and the expression of MSMO1 and NSDHL was determined in MSMO1 siRNA transfected or MSMO1 siRNA and pCMV-NSDHL co-transfected 3T3-L1 preadipocytes by qRT-PCR after transfected 24 h. (*P < 0.05, ***P < 0.001 vs. siMSMO1-1 or scramble. β-actin mRNA was used as control). (d) Adipogenesis was assessed by Oil Red O staining and expression of PPARγ, FABP4 and C/EBPα on D9. Scale bar indicates 100 µm. (*P < 0.05, **P < 0.01 vs. scramble or siMSMO1-1+ NSDHL. β-actin mRNA was used as control).