Figures & data
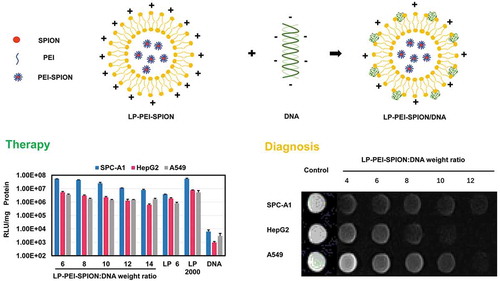
Figure 1. Synthesis of PEI-SPION.
Evaluations of PEI-SPION. (a) Proposed reaction scheme for the synthesis of PEI-SPION. (b) XRD pattern of SPION. (c) FT-IR images of SPION and PEI-SPION. (d) TG image of PEI-SPION. (e) Zeta potential of SPION, PEI-SPION and LP-PEI-SPION/DNA. (f) Magnetic hysteresis loops of SPION and PEI-SPION.
Figure 2. Characterization of PEI-SPION. (a) TEM image of SPION. (b) TEM image of PEI-SPION. (c) TEM image of LP-PEI-SPION/DNA. (d) Size distribution study of SPION, PEI-SPION and LP-PEI-SPION/DNA.
Figure 3. Agarose gel electrophoresis of LP-PEI-SPION/DNA complexes at various weight ratios, and naked DNA was as control.
Figure 4. Cell viability of LP-PEI-SPION/DNA complexes at various weight ratios in three different cell lines. (a) SPC-A1, (b) HepG2 and (c) A549. Data was obtained from three independent experiments (mean ± SD, n = 3).
Figure 5. Transfection efficiency of LP-PEI-SPION/pGL3 complexes at various weight ratios in three different cell lines, and LP 6, Lipofectamine® 2000 (LP 2000) and naked DNA (DNA) were controls. (a) SPC-A1, (b) HepG2, (c) A549 (mean ± SD, n = 3). Compared with LP 2000, *P < 0.05.
Figure 6. Cell morphology after transfection with LP-PEI-SPION/DNA 6, LP/DNA 6 and LP 2000/DNA.
LP-PEI-SPION/pEGFP-N2 complexes at weight ratio 6 were transfected into SPC-A1 cells. LP and Lipofectamine® 2000 were used as controls. The transfection efficiency (%) was defined as (Number of EGFP positive cells/Number of total cells) × 100%.
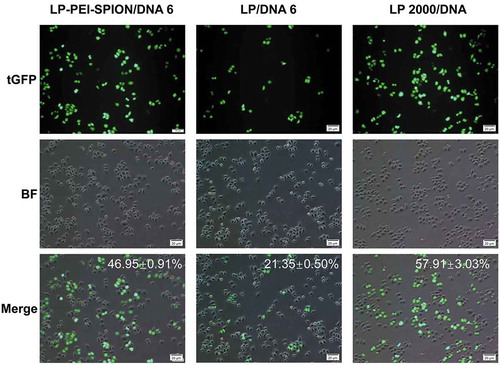
Figure 7. Cell uptake of LP-PEI-SPION/pGL3 complexes. Representative Prussian blue staining micrographs show obvious uptake of nanoparticles. Prussian blue staining images after 4 h of incubation with LP-PEI-SPION/pGL3 complexes at the weight ratio of 6 in (a) HepG2 and (b) SPC-A1.
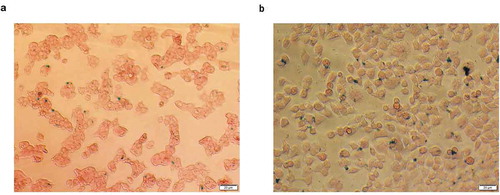
Figure 8. MRI of LP-PEI-SPION/pGL3 complexes in vitro. (a) Images T2-weighted MRI with LP-PEI-SPION/pGL3 complexes at various weight ratios in SPC-A1, HepG2 and A549 cells (TE = 117 ms). (b) IOD of MRI images in three cell lines.