Figures & data
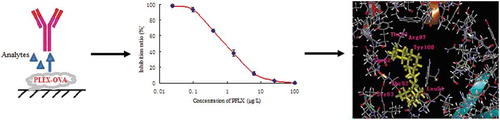
Figure 1. Standard curve of PFLX by dc–ELISA.
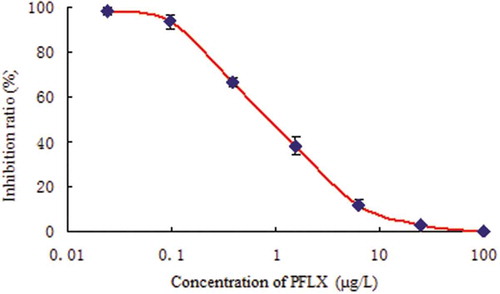
Table 1. Cross reactions (CRs) of mAb with PFLX and other bactericide analogs.
Figure 2. Cloning of the VH and VL chain genes and the scFv gene assembly. (a) Agarose gel electrophoresis of VH and VL genes of PFLX. Lane M, DL 2000 DNA marker; Lane 1, VL gene. Lane 2, VH gene. (b) Agarose gel electrophoresis of scFv of PFLX. Lane M, DL 2000 DNA marker; Lane 1, scFv gene.
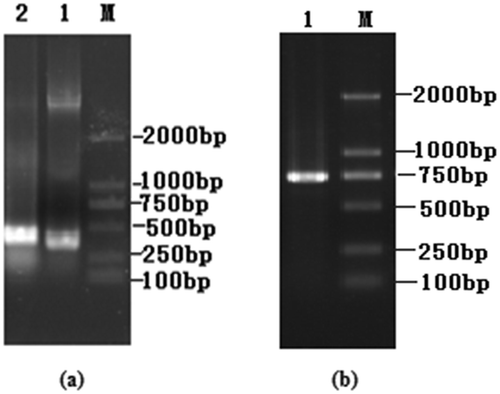
Figure 3. SDS–PAGE analysis of the anti–PFLX scFv–AP fusion protein.
Lane M, marker 116 kDa; Lane 1, before induction; Lane 2, after induction; Lane 3, the supernatant; Lane 4, purified scFv-AP.
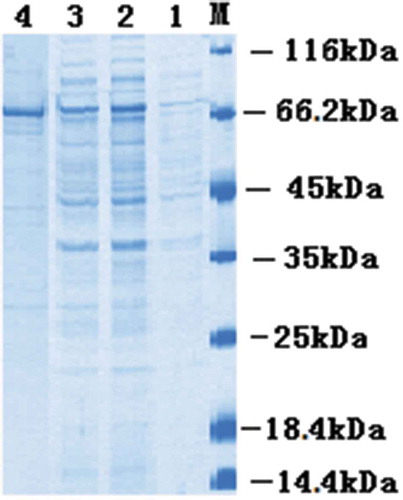
Figure 4. Validation of the homology model by Ramachandran analysis.
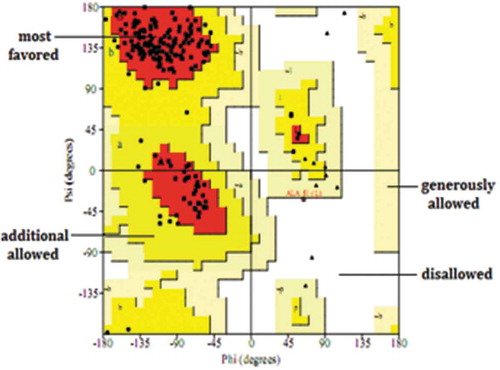
Figure 5. The variable regions of antibody interaction with PFLX. (a) The variable region 3D structure in complex with the ligand PFLX. (b) The pocket of the binding site. Residues that contribute most to the binding energy are represented as sticks model and labeled.
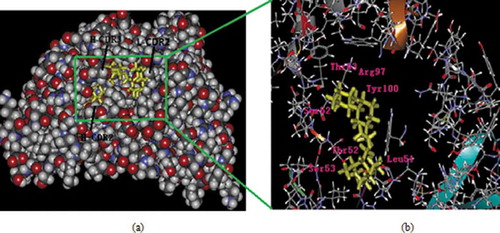
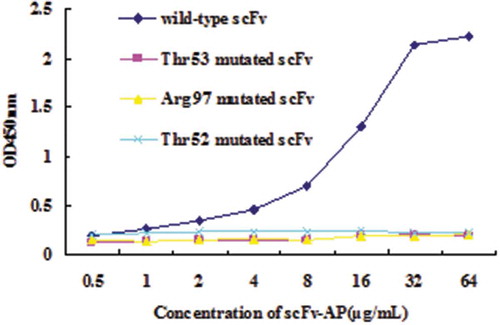
Figure 6. ELISA assay for mutated scFvs.