Figures & data
Figure 1. Defective SKO1 function suppressed oxidative stress of the hog1Δ strain and extended the chronological lifespan (CLS).
(a) Growth of various strains on solid YPD medium containing the indicated concentrations of hydrogen peroxide. Ten-fold serially diluted cells of W303-1A (wild-type; WT), hog1Δ, hog1Δ tup1-484, hog1Δ sko1-18, and hog1Δ cyc8-389 were spotted onto YPD solid medium containing various concentrations of hydrogen peroxide. The cells were then grown at 25ºC for 3 days before visualization. (b) CLS curves for WT, hog1Δ, hog1Δ tup1-484, hog1Δ sko1-18, and hog1Δ cyc8-389 are shown. Yeast CLS analysis was performed in liquid SDC medium as previously described [Citation12]. Briefly, SDC cultures grown overnight were diluted (2 x 10⁶ cells/ml) in fresh SDC medium and incubated at 28ºC with shaking at 180 rpm. Viability was measured by plating aging cells onto YPD plates and monitoring Colony Forming Units (CFUs) starting from day 3, which was considered to be the initial survival (100%). All data are represented as the average of 3 independent experiments conducted at the same time. At least 2 sets of CLS experiments were performed with similar outcomes. CLS assays were performed with SDC medium [Citation12]. Data represent biological replicates. GraphPad Prism 7 (GraphPad Software) was used for comparison of CLS, and p values were derived from a two-way ANOVA with time and strain used as independent factors. A p value less than p< 0.05 was defined as statistically significant. (c) CLS curves of WT, hog1Δ, and hog1Δ sko1 are shown. Experimental conditions were as described in (b).
![Figure 1. Defective SKO1 function suppressed oxidative stress of the hog1Δ strain and extended the chronological lifespan (CLS).(a) Growth of various strains on solid YPD medium containing the indicated concentrations of hydrogen peroxide. Ten-fold serially diluted cells of W303-1A (wild-type; WT), hog1Δ, hog1Δ tup1-484, hog1Δ sko1-18, and hog1Δ cyc8-389 were spotted onto YPD solid medium containing various concentrations of hydrogen peroxide. The cells were then grown at 25ºC for 3 days before visualization. (b) CLS curves for WT, hog1Δ, hog1Δ tup1-484, hog1Δ sko1-18, and hog1Δ cyc8-389 are shown. Yeast CLS analysis was performed in liquid SDC medium as previously described [Citation12]. Briefly, SDC cultures grown overnight were diluted (2 x 10⁶ cells/ml) in fresh SDC medium and incubated at 28ºC with shaking at 180 rpm. Viability was measured by plating aging cells onto YPD plates and monitoring Colony Forming Units (CFUs) starting from day 3, which was considered to be the initial survival (100%). All data are represented as the average of 3 independent experiments conducted at the same time. At least 2 sets of CLS experiments were performed with similar outcomes. CLS assays were performed with SDC medium [Citation12]. Data represent biological replicates. GraphPad Prism 7 (GraphPad Software) was used for comparison of CLS, and p values were derived from a two-way ANOVA with time and strain used as independent factors. A p value less than p< 0.05 was defined as statistically significant. (c) CLS curves of WT, hog1Δ, and hog1Δ sko1 are shown. Experimental conditions were as described in (b).](/cms/asset/3b841c10-ab60-4d50-a933-fcce20e719f6/tbbb_a_1571901_f0001_c.jpg)
Figure 2. CLS extension by loss of SKO1 strains is required for the glycerol synthesis.
(a) CLS curves for WT, sko1Δ, gpd1Δ gpd2Δ, and hog1Δ gpd1Δ gpd2Δ are shown. Experimental conditions were as described in . (b) Osmotic (KCl) (left panel) and hydrogen peroxide (right panel) test. Ten-fold serially diluted cells of WT, sko1Δ, gpd1Δ gpd2Δ, and sko1Δ gpd1Δ gpd2Δ strains were spotted onto solid medium containing KCl or hydrogen peroxide at 25ºC and incubated for 3 days.

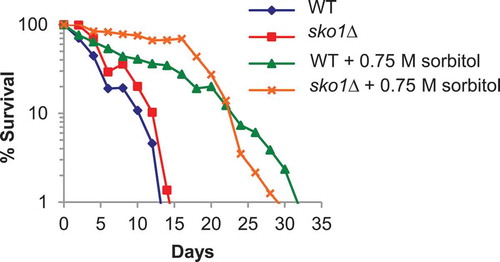
Figure 3. CLS extension by sko1Δ is distinct from hyperosmolarity-promoted longevity.
CLS curves for WT and sko1Δ in the presence or absence of hyperosmolarity (0.75 M sorbitol) are shown. Experimental conditions were as described in .