Figures & data
Figure 1. Effects of inorganic salts on ATPase activity.
Magenta and cyan bars represent mean relative values of ATPase activity obtained in three independent measurements (n = 3) for SVNTase and SANTase, respectively. Error bars indicate the standard deviation. The values for the controls (indicated by horizontal dashed lines) were obtained in the presence of 10 mM MgCl2 without other salts, and are regarded as 100% activity, where the specific activities of SVNTase and SANTase are 196.2 ± 20.4 and 184.8 ± 17.6 U/mg protein, respectively.
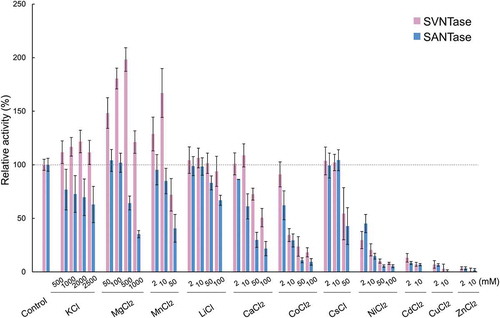
Figure 2. Effects of inorganic salts on the α-helix structure.
Magenta and cyan bars represent mean α-helix content values obtained in three independent measurements (n = 3) for SVNTase and SANTase, respectively. Error bars indicate the standard deviation. Asterisks represent significant difference (p < 0.05). The values for the controls were obtained in the absence of an inorganic salt.
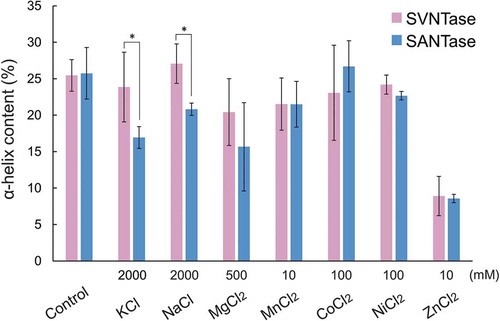
Figure 3. Catalytic sites in simulated structures of SVNTase and SANTase.
The catalytic sites are enlarged from the superimposed whole structures of SVNTase (magenta) and SANTase (cyan) shown as a ribbon model. Two divalent metal cations (grey) and an ATP analog, phosphomethylphosphonic acid adenosyl ester (black), are shown as sphere and stick models, respectively. Amino acid side chains in the catalytic sites of SVNTase (magenta) and SANTase (cyan) are also shown as stick models.
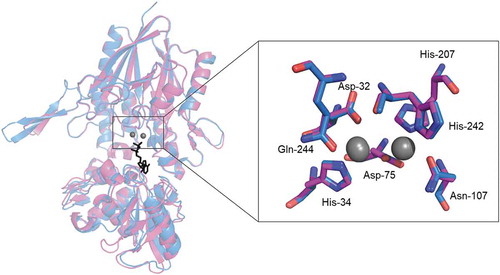
Figure 4. Effects of organic solvents on ATPase activity.
Magenta and cyan bars represent mean relative values of ATPase activity obtained in three independent measurements (n = 3) for SVNTase and SANTase, respectively. Error bars indicate the standard deviation. The values for the controls (indicated by horizontal dashed lines) were obtained in the presence of 10 mM MgCl2 without organic solvents, and are regarded as 100% activity, where the specific activities of SVNTase and SANTase are 196.2 ± 20.4 and 184.8 ± 17.6 U/mg protein.
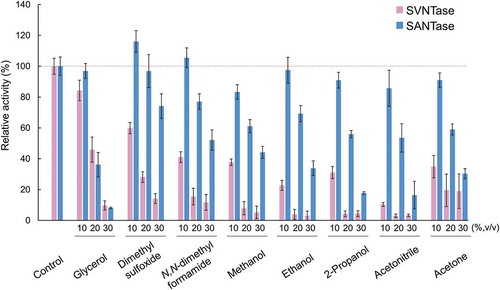
Figure 5. Effects of organic solvents on the α-helix structure.
Magenta and cyan bars represent mean α-helix content values obtained in three independent measurements (n = 3) for SVNTase and SANTase, respectively. Error bars indicate the standard deviation. Asterisks represent significant differences (p < 0.05). The values for the controls were obtained in the absence of an organic solvent.
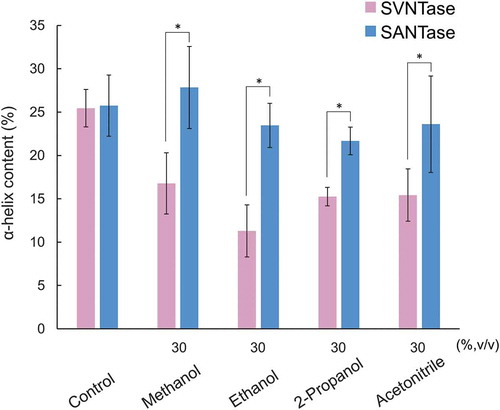
Figure 6. Thermal stability as measured by CD spectra.
Closed circles, magenta (SVNTase) and cyan (SANTase), are representative normalized data points plotted with temperature intervals of 2.5°C. Solid lines, magenta (SVNTase) and cyan (SANTase), are their fitted curves.
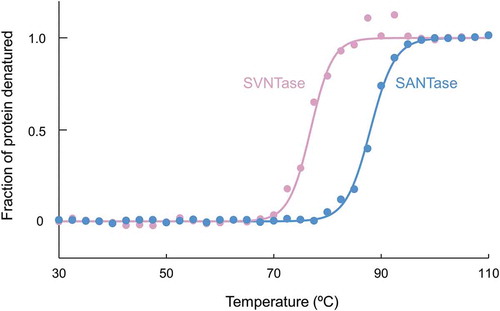
Figure 7. Surface residues that differ between SVNTase and SANTase in terms of hydrophobicity and hydrophilicity.
Main chain structures (ribbon model) of SVNTase (magenta) and SANTase (cyan) are shown. Eighteen hydrophobic and hydrophilic side chains on the molecular surfaces are shown as sphere and stick models, respectively.
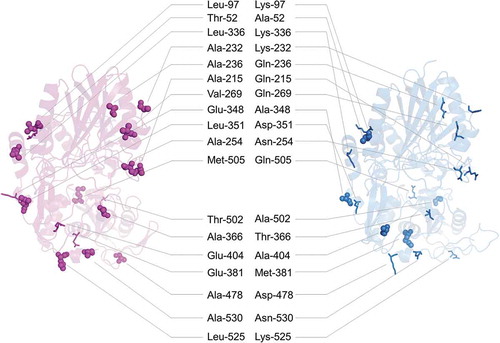
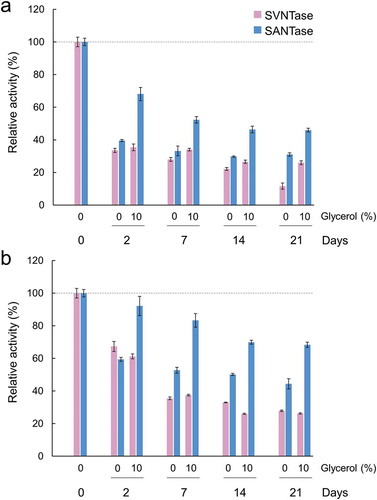
Figure 8. Long-term storage of SVNTase and SANTase at 30°C (a) and at 4°C (b).
Magenta and cyan bars represent mean relative values of ATPase activity obtained in three independent measurements (n = 3) for SVNTase and SANTase, respectively. Error bars indicate the standard deviation. The values for day 0 were obtained in the presence of 10 mM MgCl2 without glycerol, and are regarded as 100% activity, where the specific activities of SVNTase and SANTase are 196.2 ± 20.4 and 184.8 ± 17.6 U/mg protein, respectively.