Figures & data
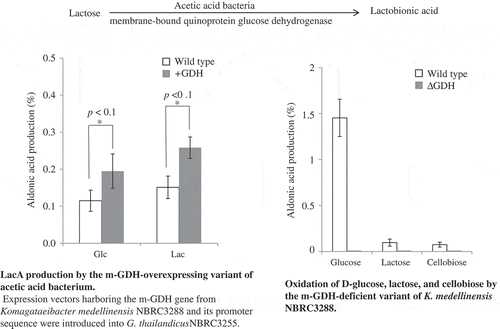
Table 1. Sugar oxidizing activities of AABs.
Figure 1. Comparison of d-glucose- and lactose-oxidizing activities of AABs.
LacA-production values are plotted against the d-glucose-oxidizing activity of AABs. The plotted values are from our previous work [Citation10]. The LacA production values of NBRC3281 and IFO3283 are 0.0003 and 0.0005%, respectively. The activities on d-glucose of NBRC3281 and IFO3283 are 0.0005 and 0.0006 U/mL, respectively.
![Figure 1. Comparison of d-glucose- and lactose-oxidizing activities of AABs.LacA-production values are plotted against the d-glucose-oxidizing activity of AABs. The plotted values are from our previous work [Citation10]. The LacA production values of NBRC3281 and IFO3283 are 0.0003 and 0.0005%, respectively. The activities on d-glucose of NBRC3281 and IFO3283 are 0.0005 and 0.0006 U/mL, respectively.](/cms/asset/f84fb023-0fb6-4a0f-a1ab-f1e02c2633e6/tbbb_a_1580136_f0001_b.gif)
Figure 2. Effect of d-glucose addition on lactose oxidation by resting cells.
Inhibition of lactose oxidation by d-glucose was investigated. Resting cells of NBRC3285 (a) and NBRC3288 (b) were reacted with lactose (138 mM) and 0, 28, 56, or 111 mM d-glucose. After 1-h reaction, LacA production was measured using HPAEC-PAD (white bars). The pH values of the reaction mixtures were also measured in two independent experiments (squares). *: below detection limit.
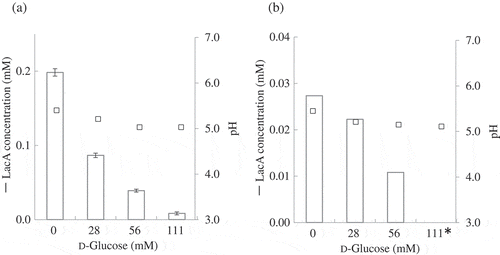
Figure 3. LacA production by m-GDH-overexpressing variant of AABs. Expression vectors harboring the m-GDH gene from K. medellinensis NBRC3288 and its promoter sequence were introduced into G. oxydans NBRC3244 (a) and G. thailandicus NBRC3255 (b).
Lactose and d-glucose were oxidized by resting cells of wild-type and mutant strains. Aldonic acid production was measured using HPAEC-PAD (n = 3–5).
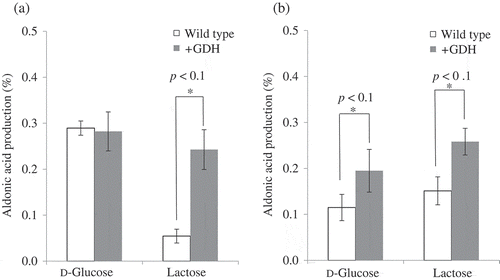
Figure 4. Oxidation of d-glucose, lactose, and cellobiose by m-GDH-deficient variant of NBRC3288. Resting cells of NBRC3288 wild-type and m-GDH-deficient variant were prepared, and sugar-oxidizing activities were measured using HPAEC-PAD (n = 3–5).
The graph shows the production of d-gluconic acid, LacA, and cellobionic acid by the wild-type strain (white bars) and mutant strain (gray bars).
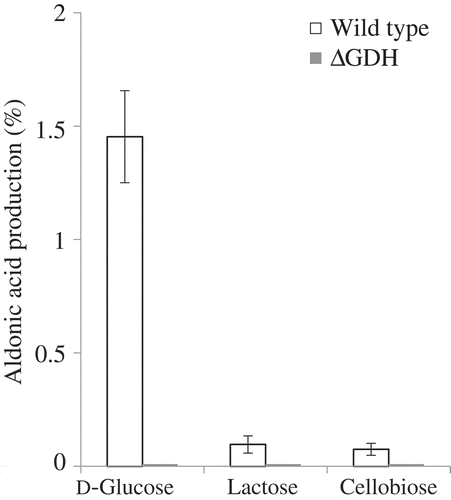
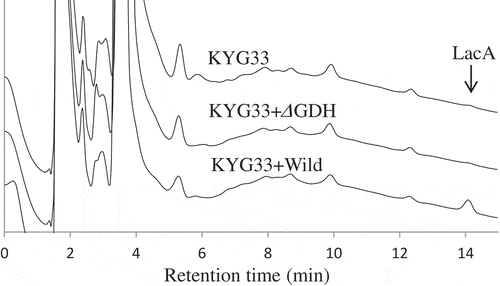
Figure 5. HPAEC-PAD analysis of LacA production in yogurts fermented by wild-type and m-GDH-deficient variant of NBRC3288.
Yogurts were fermented by NBRC3288 wild-type strain (KYG33 + Wild) or m-GDH-deficient variant (KYG33 + ΔGDH) added with L. lactis subsp. cremoris KYG33, or by KYG33 alone (without AAB addition; KYG33). LacA in the yogurts was measured using HPAEC-PAD.