Figures & data
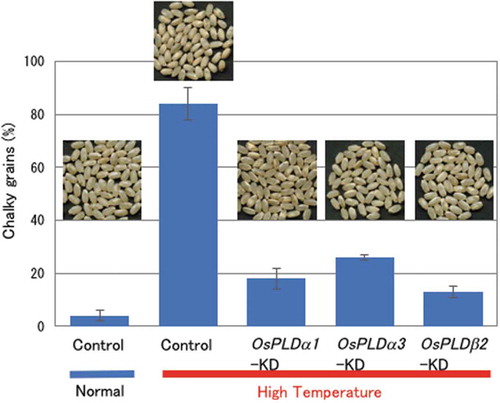
Figure 1. Changes in chalky grain production of the PLD gene-KD plants in HT growth conditions.
(a) Each plant was grown in a greenhouse in normal conditions (27°C/25°C) before flowering, and then it was grown in HT conditions (33°C/29°C). Values represent the ratio of chalky grains and average of triplicate experiments of two individual plants, and the error bars indicate SD. The symbols, *, **, and *** indicate a significant difference from the control (HT) at the 0.2%, 0.03%, and 0.01% levels, respectively, as determined by using Student’s t-test. (b) Appearance of grains. (c) Accumulation of OsPLDα1, OsPLDα3, or OsPLDβ2 mRNAs in the grains of the OsPLDα1-KD, OsPLDα3-KD, OsPLDβ2-KD, or vector-control plants in HT growth conditions. Homozygote KD and vector-control plants were grown in a greenhouse, and after flowering they were grown in HT conditions. Total RNA was extracted from grains at 10 DAF. The values were standardized using the expression level of a rice polyubiqutin gene (RUBIQ1). Values represent the averages of three individual plants, and the error bars indicate SD.
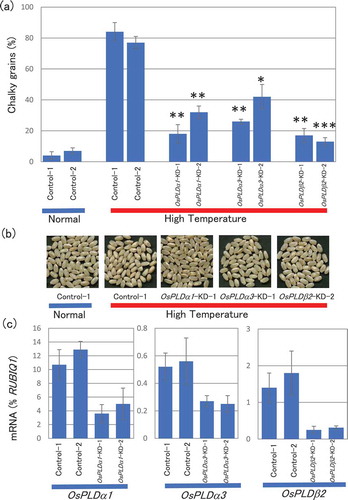
Figure 2. Accumulation of H2O2 (a) and ROS-scavenging activity (b) in developing grain grown in normal or HT conditions. Each plant was grown in a greenhouse in normal conditions (27°C/25°C) before flowering and then, it was grown under normal or high temperature conditions (33°C/29°C). Each test sample was harvested at 10 DAF. (a) H2O2 was analyzed in the grains using the luminol chemiluminescence method. Values represent averages of triplicate experiments of three individual plants, and the error bars indicate SD. (b) The catalase-like activity was analyzed using H2O2 as a substrate. The values represent the average of triplicate experiments of three individual plants, and the error bars indicate SD. The symbol indicates a significant difference from the control plants at the 0.2% level.
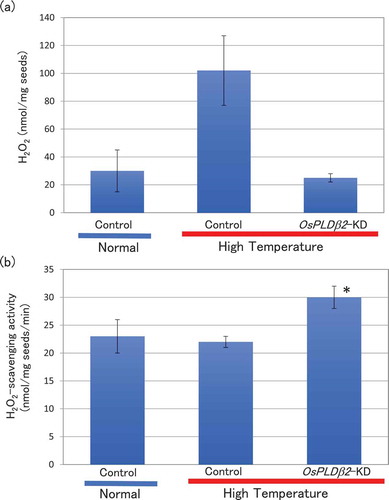
Figure 3. Accumulation of OsCATA, OsCATB, or OsCATC mRNA in the grains of the vector-control or OsPLDβ2-KD plants in HT growth conditions. Each plant was grown in a greenhouse, and after flowering they were grown in HT conditions. Total RNA was extracted from the grains at 10 DAF. The values were standardized using the expression levels of a rice polyubiqutin gene (RUBIQ1). Values represent the average of triplicate experiments of three individual plants, and the error bars indicate SD. The symbol indicates a significant difference from the control at the 0.05% level.
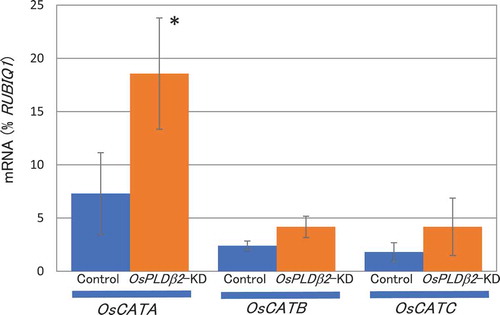
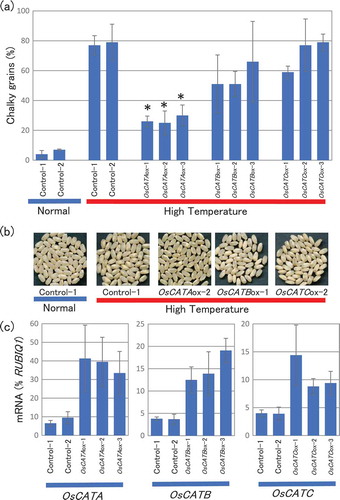
Figure 4. Changes in chalky grain production of the catalase gene overexpression plants in HT growth conditions. (a) Each plant was grown in a greenhouse in normal conditions (27°C/25°C) before flowering, and then it was grown in HT conditions (33°C/29°C). Values represent the ratio of chalky grains and the average of triplicate experiments, and the error bars indicate SD. The symbol indicates a significant difference from the control plants (HT) at the 0.01% level. (b) Appearance of grains. (c) Accumulation of OsCATA, OsCATB, or OsCATC mRNA in the grains of the OsCATA-ox, OsCATB-ox, OsCATC-ox, or vector-control plants in HT growth conditions. The homozygote ox and vector-control plants were grown in a greenhouse and after flowering they were grown in HT conditions. Total RNA was extracted from the grains at 10 DAF. Values were standardized to the expression levels of a rice polyubiqutin gene (RUBIQ1). Values represent the average of three individual plants, and the error bars indicate SD.