Figures & data
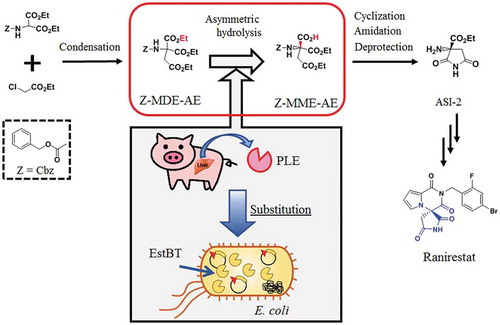
Figure 1. Scheme for the synthesis of ASI-2 via the bioconversion of Z-MDE-AE to Z-MME-AE.
Z-MDE-AE is synthesized by condensation. Z-MME-AE is synthesized by bioconversion of Z-MDE-AE. ASI-2 is synthesized from Z-MME-AE by cyclization, amidation, and deprotection. Z, Z-MDE-AE, Z-MME-AE, and ASI-2 indicate benzyloxycarbonyl group (Cbz), diethyl 2-benzyloxycarbonylamino-2-ethoxycarbonylsuccinate, (R)-1-ethyl hydrogen 3-benzyloxycarbonylamino-3-ethoxycarbonylsuccinate, and (R)-2-amino-2-ethoxycarbonylsuccinimide, respectively.
Table 1. Purification of esterase from Bacillus thuringiensis NBRC13866.
Figure 2. SDS-PAGE of EstBT from Bacillus thuringiensis NBRC13866.
Lane 1, size marker; lane 2, the active fraction of Mono Q; lane 3, the active fraction of Benzamidine Sepharose.
Table 2. Features and identities between EstBT and known proteins.
Figure 3. Nucleotide sequence of estBT from Bacillus thuringiensis NBRC13866 and deduced amino acid sequence of full-length EstBT.
The conserved G-X-S-X-G motif of serine type proteases is boxed. The amino acid sequence at the N-terminus of EstBT purified from Bacillus thuringiensis NBRC13866 is underlined. Directing arrows indicate primers used to construct estBT expression vectors.
Figure 4. SDS-PAGE of crude extracts from recombinant Escherichia coli JM109 expressing the estBT gene and the purified rEstBT.
Lane 1, size marker; lane 2, the crude extracts from recombinant E. coli JM109 harboring pQE-70; lane 3, the crude extracts from recombinant E. coli JM109 harboring pBTEST38; lane 4, the rEstBT purified from the recombinant E. coli JM109 harboring pBTEST38.
Table 3. Comparison of the relative activity between EstBT, rEstBT, rEstBT-full, and PLE.
Figure 5. Determination of optimal pH and temperature by recombinant Escherichia coli JM109 producing rEstBT.
(a) Effect of pH. Activity was assayed under standard reaction conditions, except for the buffer. Open circle, open triangle, open square, and closed circle indicate acetic acid-sodium acetate buffer (AS), sodium phosphate buffer (NaP), Tris buffer (Tris), and borate buffer (borate), respectively. (b) Effect of reaction temperature. Activity was assayed under standard reaction conditions, except for temperature. (c) Temperature stability of rEstBT. Activity was assayed under standard reaction conditions. Reaction mixture was incubated for 30 min at 20–70°C before adding substrate. Open square indicates no temperature treatment. Open circle indicates temperature treatment at 20–70°C.
Figure 6. Bioconversion of Z-MDE-AE to Z-MME-AE with enzymes at a final activity concentration of 100 mU/mL.
(a) Bioconversion with purified enzymes. Substrate is 89 mM Z-MDE-AE. Closed circle, closed triangle, and closed square indicate Z-MDE-AE concentrations of native EstBT, recombinant EstBT, and commercial PLE, respectively. Open circle, open triangle, and open square indicate Z-MME-AE concentrations of native EstBT, recombinant EstBT, and commercial PLE, respectively. Vertical bars indicate standard deviation (SD) from three independent experiments. (b) Bioconversion using recombinant Escherichia coli JM109 producing rEstBT. Substrate is 89 mM Z-MDE-AE. Closed circle and open circle indicate Z-MDE-AE and Z-MME-AE concentrations, respectively. Vertical bars indicate standard deviation (SD) from three independent experiments.