Figures & data
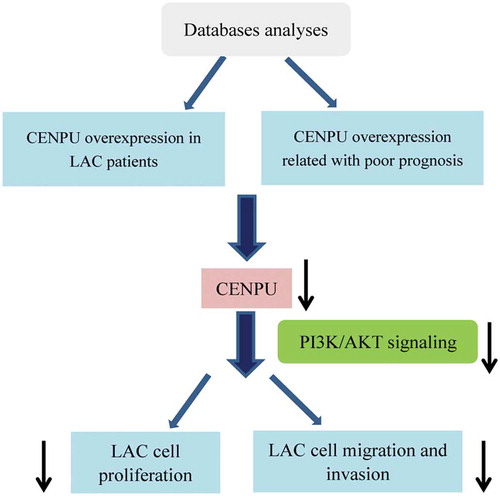
Figure 1. CENPU was upregulated in both LAC clinical tissues and cells.
(a-e), Relative level of CENPU in LAC tissues and normal controls collected from 5 cohorts. (f), Relative mRNA level of CENPU in LAC cells and normal lung cells. The data are presented as the means ± SD from three independent experiments. **P < 0.01.
Table 1. The relationship between CENPU expression and clinicopathological features of LAC patients.
Table 2. Univariate and multivariate analysis for overall survival in LAC.
Figure 2. Kaplan-Meier survival curves of overall survival (OS) based on CENPU expression.
OS rate of patients with low-expression of CENPU were remarkably lower than those of the CENPU-overexpressed patients (log-rank test, P < 0 001)
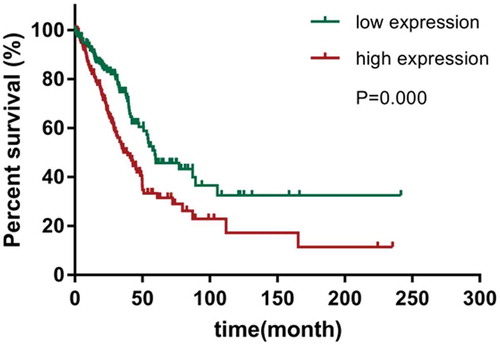
Figure 3. CENPU silencing inhibited LAC cell proliferation.
(a-b), The expression of CENPU silenced A549 cells were identified by measuring its mRNA and protein level using qRT-PCR and western blot analyses. (c), The OD values of A549 cells were detected by CCK-8 assay. (d), Colony formation assay determined the effect of CENPU knockdown in colony formation ability in A549 cells. The data are presented as the means ± SD from three independent experiments. **P < 0.01.
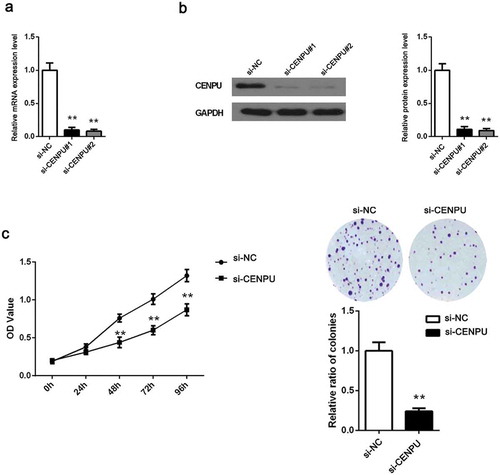
Figure 4. CENPU silencing repressed the migration and invasion of LAC cells.
(a), Cell migration was determined by a wound-healing assay in the A549 cells transfected with the si-SPOCK1 or si-NC, and the migration rate was quantified. (b), Transwell assays of A549 cells after treatment with si-SPOCK1 or si-NC. The data are presented as the means ± SD from three independent experiments. Scale bar 200 µm. Original magnification: ×200. **P < 0.01.
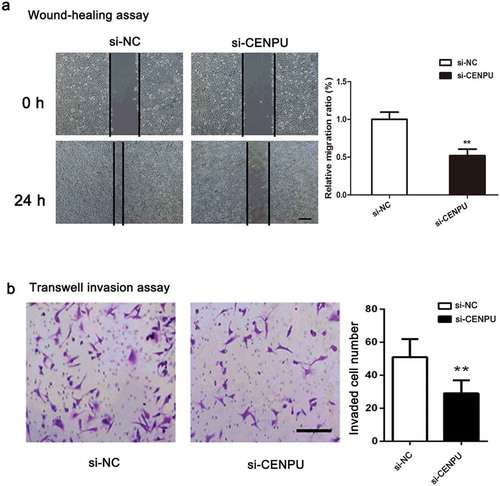
Figure 5. Downregulation of CENPU suppressed the PI3K/AKT signaling pathway.
(a), Western blot analysis shows changes in the PI3K/AKT signaling pathway components in si-A549 cells. (b), Quantitative analysis of these proteins bands. The data are presented as the means ± SD from three independent experiments. **P < 0.01.