429
Views
12
CrossRef citations to date
0
Altmetric
Food & Nutrition Science

Ingestion of difructose anhydride III partially suppresses the deconjugation and 7α-dehydroxylation of bile acids in rats fed with a cholic acid-supplemented diet

, , , , , , , , , , , & show all
Pages 1329-1335 | Received 09 Jan 2019, Accepted 06 Mar 2019, Published online: 26 Mar 2019

Figures & data

Table 1. Diet compositions.

Figure 1. Feeding schedule.

After acclimation for 1 week, the rats were divided into two groups, including those fed with control diet (C) and DFAIII-supplemented diet (D) for 2 weeks. Rats from each group were further divided into two groups and fed the diet supplemented with CA (CB and DB) or without CA (C and D) (n = 8 each) for another 2 weeks.
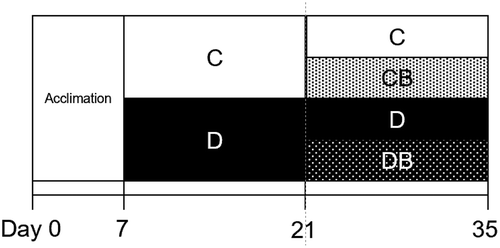
Figure 1. Feeding schedule.After acclimation for 1 week, the rats were divided into two groups, including those fed with control diet (C) and DFAIII-supplemented diet (D) for 2 weeks. Rats from each group were further divided into two groups and fed the diet supplemented with CA (CB and DB) or without CA (C and D) (n = 8 each) for another 2 weeks.

Figure 2. Changes in fecal DFAIII excretion in the rats fed with DFAIII with or without CA supplementation.

The proportion of fecal DFAIII following DFAIII supplementation was calculated in D (open circle, n = 8) and DB (closed circle, n = 8) groups. Asterisk represents significant differences in the values between groups at the same time point (P < 0.05).
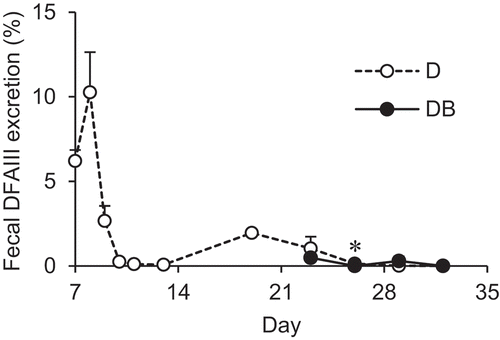
Figure 2. Changes in fecal DFAIII excretion in the rats fed with DFAIII with or without CA supplementation.The proportion of fecal DFAIII following DFAIII supplementation was calculated in D (open circle, n = 8) and DB (closed circle, n = 8) groups. Asterisk represents significant differences in the values between groups at the same time point (P < 0.05).

Figure 3. Distribution of BAs in the rats fed with four different diets at the end of the experimental period.

BA concentrations were measured in the aorta plasma, portal plasma, liver, ileal contents, cecal contents, and feces of the rats fed with four different diets. Values are the mean ± SEM (n = 7 or 8 rats per group). Two-way ANOVA was used to determine significant differences (P < 0.05).
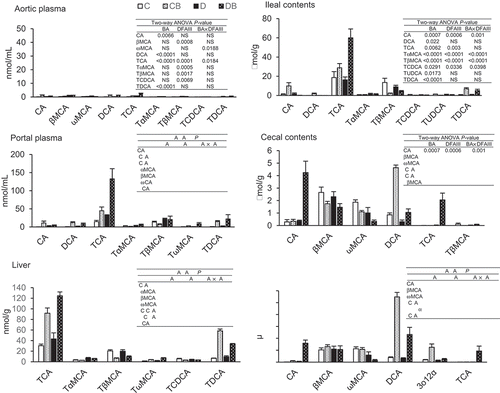
Figure 3. Distribution of BAs in the rats fed with four different diets at the end of the experimental period.BA concentrations were measured in the aorta plasma, portal plasma, liver, ileal contents, cecal contents, and feces of the rats fed with four different diets. Values are the mean ± SEM (n = 7 or 8 rats per group). Two-way ANOVA was used to determine significant differences (P < 0.05).

Table 2. Growth and other parameters in the rats.

Reprints and Corporate Permissions

Please note: Selecting permissions does not provide access to the full text of the article, please see our help page How do I view content?

To request a reprint or corporate permissions for this article, please click on the relevant link below:

Academic Permissions

Please note: Selecting permissions does not provide access to the full text of the article, please see our help page How do I view content?

Obtain permissions instantly via Rightslink by clicking on the button below:

If you are unable to obtain permissions via Rightslink, please complete and submit this Permissions form. For more information, please visit our Permissions help page.