Figures & data
Figure 1. Relative expression of HNF1β in fetal kidney and Wilms’ tumor. (a) Expression of HNF1β low in Wilms’ tumor and human Fetal kidney. (b) Expression of HNF1β in Fetal kidney cell line (293FT) and Wilms’ tumor cell lines (G401). (c) Expression of HNF1β in murine kidney tissues.
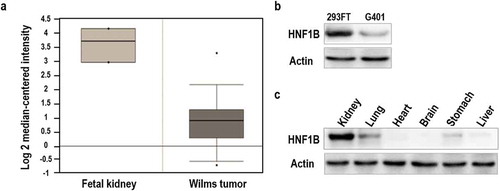
Figure 2. Analysis of relative HNF1β expression levels and its effects on Six2 and E-cadherin by quantitative polymerase chain reaction (qPCR) and western blotting. (a) The relative expression of Hnf1β overexpression in G401 cells was significantly higher compared with control. (b) HNF1β was decreased in G401 cells treated with Hnf1β-siRNA. Overexpression of HNF1β downregulated Six2 mRNA but upregulated E-cadherin mRNA expression, respectively, and inversely upregulated Six2 and downregulated E-cadherin when knock-down (c, d) Western blot shows the opposing regulation of HNF1β on Six2 and E-cadherin. (e) E-cadherin expressed G401cells shows the association between E-cadherin, HNF1β, and Six2. (f) Transfection efficiency of lipofectamine 2000 for pcdna3.1-GFP vector show over 60% efficiency in G401 cells,Bar = 100μm, meanwhile qPCR and western-blot showed the significant efficiency of HNF1β overexpression and knock-down. Statistical analysis of gene expression (a and b) is performed with GraphPad Prism 5 software. Values were presented as mean ± SEM (n = 3), **p < 0.01, *p < 0.05.
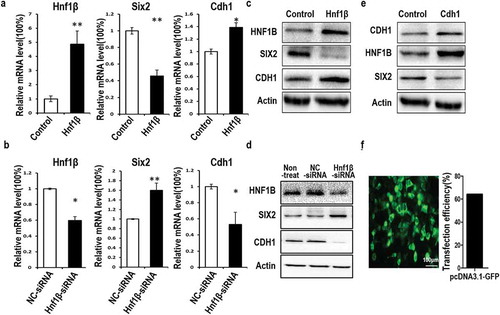
Figure 3. Overexpression of HNF1β inhibits G401 cell proliferation while Knock-down of HNF1β promotes it. (a, b) Proliferating G401 cells were labeled with EdU (red) and nuclei of the whole cells were stained with hoechst (blue). The cells were 48 h post-treated with vectors of overexpression or target siRNA or the respective control vectors. The images present were taken by fluorescent microscopy (200×) with a scale bar of 50 μm and the red and blue images were merged to the purple ones. EdU positive percentage (EdU %) were quantified. Statistical analysis of cell proliferation (a and b, Right) is performed with GraphPad Prism 5 software. Values were presented as mean ± SEM (n = 3), **p < 0.01, *p < 0.05.
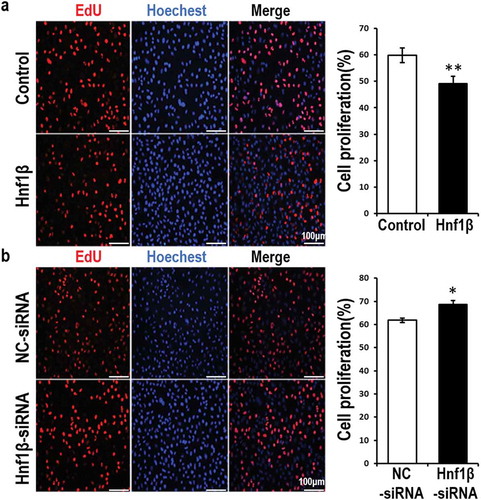
Figure 4. ver-expression of HNF1β inhibits G401 cell migration while knock-down of HNF1β had no significant value after 24 h. Cell migration of G401 cells was measured via wound healing assay. (a) The width of wound area was calculated at three time points (0, 12, 24 h) starting from the point when G401 cells were transfected 48 h later. (b and c) Cell migration rate quantification. Statistical analysis of cell migration (b and c, Right) is performed with GraphPad Prism 5 software. Values were presented as mean ± SEM (n = 3), *p < 0.05.
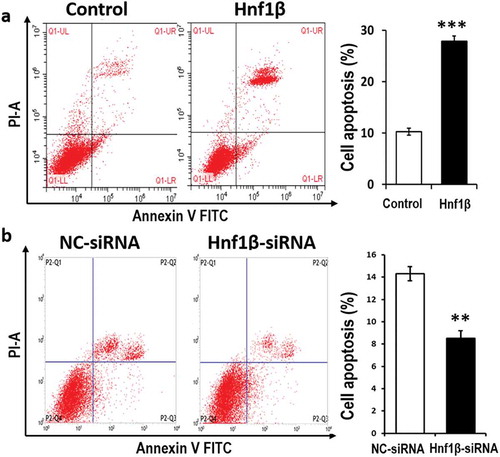
Figure 5. verexpression of HNF1β promotes G401 cell apoptosis while Knock-down of HNF1β inhibits it. (a and b) G401 cell apoptosis was detected by flow cytometry with Annexin V-FITC/PI staining. The number of positive cells double stained by AnnexinV-FITC/PI in G401 cells transfected with HNF1β overexpression vector was significantly more than the control vector. The detection was performed 48 h transfection later. (a and b, Right) Cell apoptosis rate quantification. Statistical analysis of cell migration (a and b, Right) is performed with GraphPad Prism 5 software. Values were presented as mean ± SEM (n = 3), ***p < 0.001, **P < 0.01.