Figures & data
Table 1. The length diversity of designed CDR primer library.
Table 2. The accuracy and size of various libraries.
Figure 1. The length distribution of CDR-H3 variants and CDR-H3 library.
(a) Length distribution of CDR-H3 variants. Sequences of human and mouse antibodies from the Absys database are analyzed. (b) Synthesis of two CDR-H3 libraries (6–10aa and 11–14aa). Approximately 7200 degenerate oligos for each library are synthesized by one microchip (LC Sciences). (c) Length distribution of CDR-H3 libraries by NGS. Sequence frequencies are calculated from 2 Gb Illumina data for VH3 library.
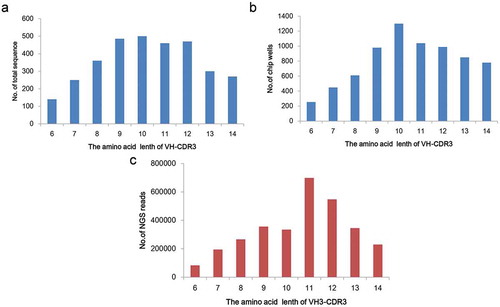
Figure 2. The frequency distribution of the CDR-H3 amino acid sequence in the antibody gene pool. (a) The amino acid frequency distributions of amino acid length diversity of 6–10, where D represents the designed amino acid and F represents the amino acid frequency of high-throughput sequencing statistics. (b) The amino acid frequency distributions of amino acid length diversity of 11–14, where D represents the designed amino acid and F represents the amino acid frequency of high-throughput sequencing statistics.
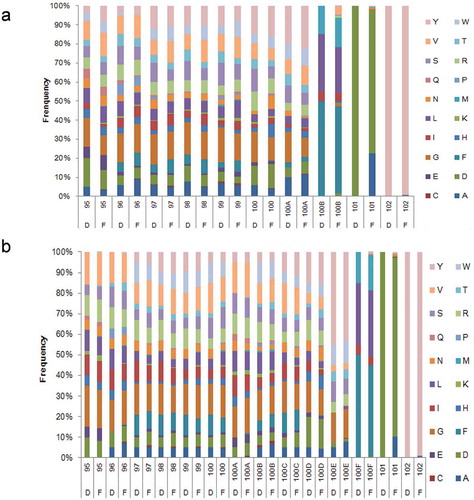
Figure 3. Detection of antibody gene pool by gel electrophoresis.
(a) Identification of six sub-libraries after enzyme digestion, M stands for DNA ladder, 1 and 2 indicate that the VK2 sub-pool is subjected to SacI and HindIII digestion; and 3 and 4 indicate that the VK3 sub-pool is subjected to SacI and HindIII digestion; 5 and 6 indicate that the VH3-lib1 sub-pool is subjected to BamHI and SalI digestion, and 7 and 8 indicate that the VH3-lib2 sub-pool is subjected to BamHI and SalI digestion. 9 and 10 indicate that the VH4-lib1 sub-pool is subjected to BamHI and SalI digestion, and 11 and 12 indicate that the VH4-lib2 sub-pool is subjected to BamHI and SalI digestion. (b) Identification of eight single-strand libraries after enzyme digestion. M represents DNA ladder, 1 and 2 indicate VK2-VH3-lib1 by SacI and SalI digestion; 3 and 4 indicate VK2-VH3-lib2 by SacI and SalI digestion; 5 and 6 indicate VK2-VH4-lib1 by SacI and SalI digestion, 7 and 8 indicate VK2-VH4-lib2 by SacI and SalI digestion, 9 and 10 indicate VK3-VH3-lib1 by SacI and SalI digestion, and 11 and 12 indicate VK3-VH3-lib2 by SacI and SalI digestion, 13 and 14 indicate VK3-VH4-lib1 by SacI and SalI digestion, and 15 and 16 indicate VK3-VH4-lib2 by SacI and SalI digestion.
Figure 4. The agarose gel electrophoresis analysis of plasmid of pCD-TIGIT-Avi-His and SDS–PAGE analysis of expressed protein TIGIT.
(a) The pCD-TIGIT-Avi-His plasmid was digested with BamHI and KpnI to detect the crystal structure of TIGIT where IgV-like (321 bp) was cloned into the vector. About 1.2% agarose gel electrophoresis was used. M indicated DNA Ladder, lanes 1, 2, 3, and 4 displayed the bands around 320 bp. (b) About 10% SDS–PAGE of eukaryotic expression of TIGIT-Avi-His protein, which showed the band size around 20–25KD.
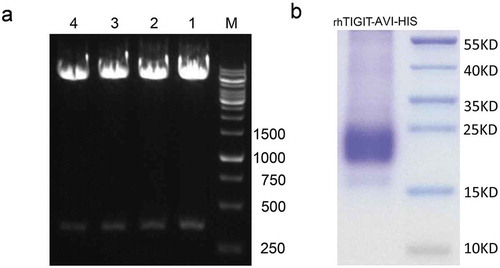
Table 3. The sources of clones in .
Table 4. IgH and IgL isotypes of used clones and Etigilimab.
Table 5. DNA sequences of whole VDJ region of AB8, AC8, CB3, and EB10, where italic indicates FR and underline indicates CDR.
Figure 5. Monoclonal antibody ELISA assay results were screened using eukaryotic expression of TIGIT-specific antigens.
It indicates the OD490 values of the positive antibody in the first (a), second (b), third (c), fourth (d), and fifth (e) rounds of monoclonal screening in the ELISA experiment. The blue column represents the ELISA result of the phage antibody, the red column represents the ELISA result of the antibody in the supernatant, and the green column represents the antibody secreted from periplasmic cavity.
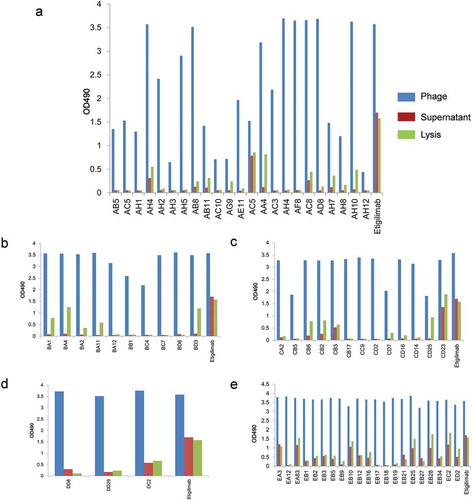
Figure 6. The EC50 value of antigen-binding activity in ELISA assay of the scfv fusion Fc eukaryotic expression monoclonal antibody.
(a) The binding activity of the monoclonal antibodies of BA4, AB8, AC5, AC8, BD3, CB2, CB3, CD23, and Etigilimab. (b) The binding activity of the monoclonal antibodies of EA3, EA83, EB2, EB3, EB5, EB10, EB12, EB21, Eb28, EC2, and Etigilimab. The black curve indicates the positive control antibody-binding activity.
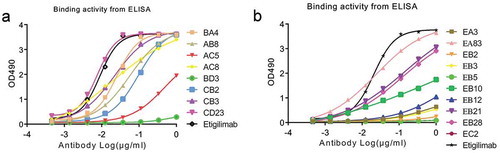
Table 6. Amino acid sequences of whole VDJ region of AB8, AC8, CB3, and EB10, where italic indicates FR and underline indicates CDR.
Figure 7. The EC50 of binding activity of eukaryotic expression of the monoclonal antibody (full-length IgG) to the antigen in an ELISA assay. The black curve indicates positive control antibody-binding activity.
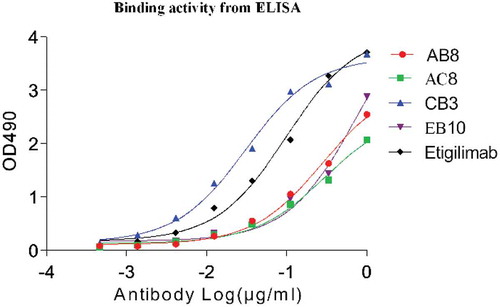
Figure 8. The binding activity (EC50) and blocking activity (IC50) of four whole human antihuman TIGIT mAbs were determined by FACS method.
(a) The fully human anti-TIGIT mAb recognizes the TIGIT protein on the cell surface. (b) The fully human antihuman TIGIT mAb is capable of blocking the interaction of the TIGIT protein on the cell surface with rhCD155-cFc. Black curve indicates the binding activity of positive control antibody. MFI indicates Median Fluorescence Intensity.
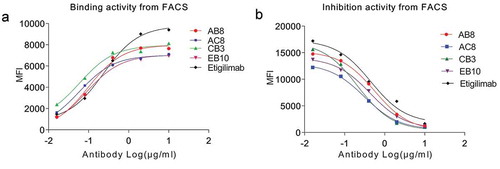
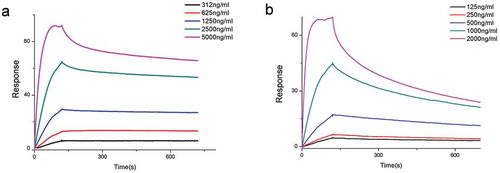
Figure 9. The binding kinetics of the fully human anti-TIGIT mAb to the rhTIGIT-Avi-His-bio protein was determined by SPR method.
(a) The equilibrium dissociation constant KD(M) of the positive control antibody Etigilimab is 1.346 × 10⁻¹⁰. (b) The equilibrium dissociation constant KD(M) of the CB3 mAb is 8.155 × 10⁻¹⁰.