792
Views
13
CrossRef citations to date
0
Altmetric
Food & Nutrition Science

Dietary intake of the citrus flavonoid hesperidin affects stress-resilience and brain kynurenine levels in a subchronic and mild social defeat stress model in mice

, , , , , & ORCID Icon show all
Pages 1756-1765 | Received 16 Feb 2019, Accepted 16 Apr 2019, Published online: 23 May 2019

Figures & data

Table 1. Dietary ingredients and food composition list of semi-purified diet (AIN-93G).

Figure 1. Experimental design of the subchronic and mild social defeat stress (sCSDS) paradigm, behavioral tests, and sampling.
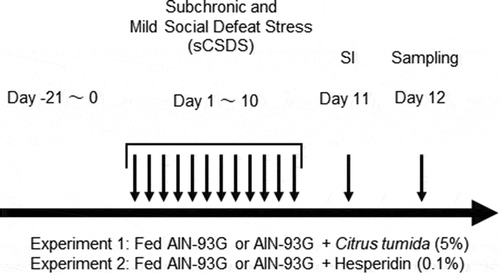
Figure 1. Experimental design of the subchronic and mild social defeat stress (sCSDS) paradigm, behavioral tests, and sampling.

Table 2. Summary of number. of susceptible and resilient mice and resilient rate in each group.

Table 3. Social interaction test.

Figure 2. Social interaction scores in the sCSDS (n = 27) and sCSDS + CT (n = 27) groups. The bar represents the mean ± SEM. Individual values are represented by circles. p values are for the unpaired two-tailed Student’s t-test. †p < 0.1. sCSDS, subchronic and mild social defeat stress.
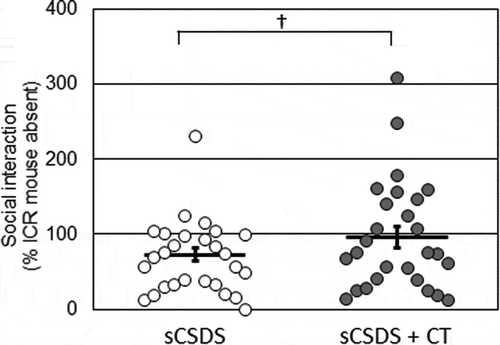
Figure 2. Social interaction scores in the sCSDS (n = 27) and sCSDS + CT (n = 27) groups. The bar represents the mean ± SEM. Individual values are represented by circles. p values are for the unpaired two-tailed Student’s t-test. †p < 0.1. sCSDS, subchronic and mild social defeat stress.

Figure 3. Social interaction scores in the control (n = 8), sCSDS (n = 15), and sCSDS + Hes (n = 17) groups. The bar represents the mean ± SEM. Individual values are represented by circles. p values are for Bonferroni’s post-hoc test. †p < 0.1, ***p < 0.001. sCSDS, subchronic and mild social defeat stress.
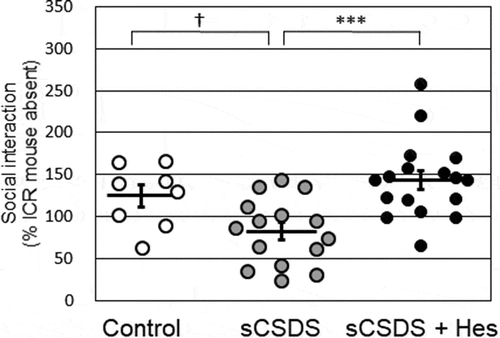
Figure 3. Social interaction scores in the control (n = 8), sCSDS (n = 15), and sCSDS + Hes (n = 17) groups. The bar represents the mean ± SEM. Individual values are represented by circles. p values are for Bonferroni’s post-hoc test. †p < 0.1, ***p < 0.001. sCSDS, subchronic and mild social defeat stress.

Table 4. Summary of number. of susceptible and resilient mice and resilient rate in each group.

Table 5. Social interaction test.

Table 6. Interleukin-6, interleukin-1β, and corticosterone levels in plasma.

Table 7. Kynurenine and tryptophan levels in brain.

Table 8. Kynurenine and tryptophan levels in blood plasma.

Supplemental material

MS2019.04.17_Supplementary_Table.pdf

Download PDF (40.5 KB)

Reprints and Corporate Permissions

Please note: Selecting permissions does not provide access to the full text of the article, please see our help page How do I view content?

To request a reprint or corporate permissions for this article, please click on the relevant link below:

Academic Permissions

Please note: Selecting permissions does not provide access to the full text of the article, please see our help page How do I view content?

Obtain permissions instantly via Rightslink by clicking on the button below:

If you are unable to obtain permissions via Rightslink, please complete and submit this Permissions form. For more information, please visit our Permissions help page.