Figures & data
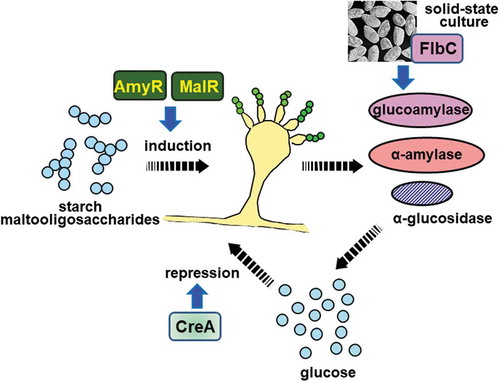
Figure 1. Schematic representation of the genomic region of the amylolytic gene cluster of A. oryzae and A. nidulans.
The gene sizes and locations were obtained from the Aspergillus genome database (AspGD; http://www.aspergillusgenome.org/). Arrows represent ORFs, showing transcriptional direction.
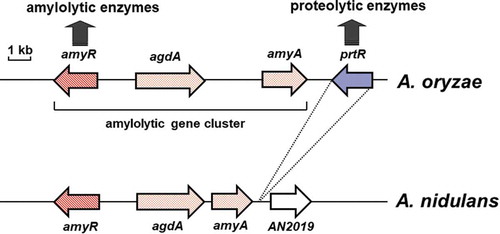
Figure 2. Schematic representation of the MAL cluster and MAL homolog clusters of A. oryzae and A. nidulans.
The gene sizes and locations were obtained from the Aspergillus genome database (AspGD). The arrows represent ORFs, showing transcriptional direction. The open boxes in genes of the MAL homolog clusters indicate intron sequences. Amino acid sequence homologies are indicated.
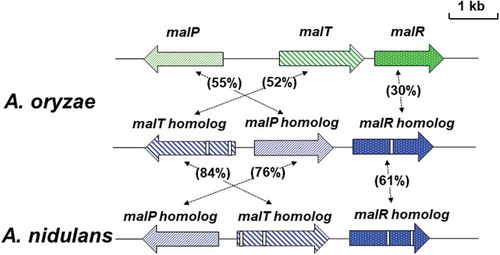
Figure 3. Maltose consumption and α-amylase production in the wild-type and deletion mutant strains.
Each strain was grown in minimal medium containing 1% casamino acid as the carbon source for 24 h, followed by transfer to fresh medium containing 0.1% maltose. The amount of maltose (solid line) and α-amylase activity (dashed line) in the culture medium was determined at the time points indicated. The wild-type, malR, malP, and amyR deletion strains are represented by a diamond, square, triangle, and circle, respectively. The amounts and activities indicated in the panels are shown as the mean ± standard deviation of three independent experiments.
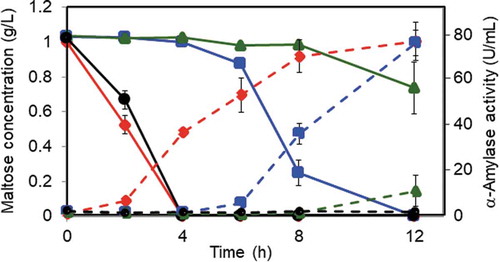
Figure 4. Schematic model for the induction of amylolytic gene expression mediated by MalR and AmyR. Detailed description of the model is referred to in the text.
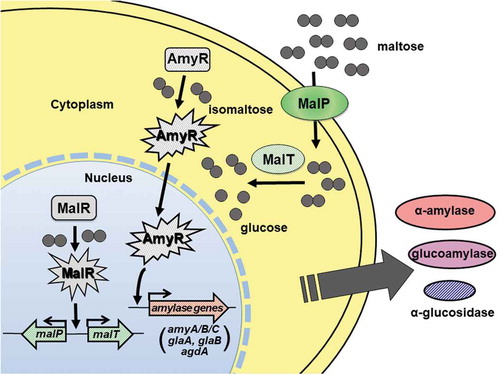
Figure 5. Identification of the transcription factor required for GlaB production by screening the A. oryzae disruption mutant library.
(a) Schematic representation of the screening procedure. (b) An example of the screening results. Nylon membranes after A. oryzae growth and GlaB detection are presented in the left and right panels, respectively. Note that the flbC deletion mutant shows no apparent signal, similar to the glaB mutant.
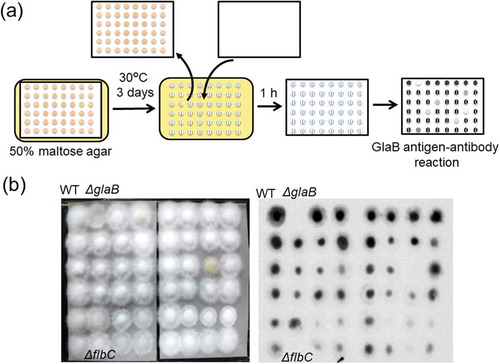
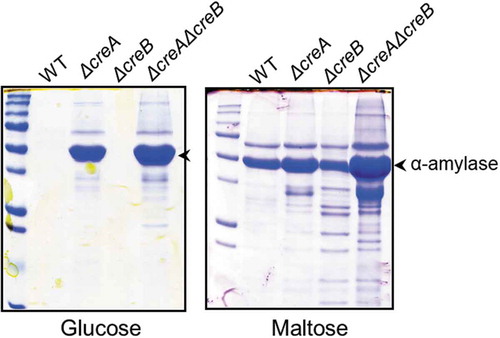
Figure 6. Sodium dodecyl sulfate-polyacrylamide gel electrophoresis (SDS-PAGE) of the creA and creB deletion mutants.
The wild-type and deletion mutant strains were grown in YP + 5% sugar (glucose or maltose) for 48 h at 30°C. Mycelia were incubated in 100 mM phosphate buffer (pH 7.0) for 1 h to release enzymes bound to the cell wall. The culture broth and phosphate buffer used for releasing enzymes from the cell wall were mixed and subjected to SDS-PAGE.