Figures & data
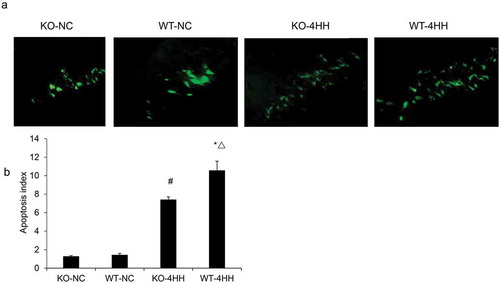
Table 1. The sequence of the primers used for qPCR.
Figure 1. TUNEL staining in the hippocampus CA1 area of each group.
(a) Representative photographs of TUNEL staining in the hippocampus CA1 area of each group (Scale bar = 25 μM). (b) Apoptosis index (AI) of hippocampus in various groups as shown in (a). #p < 0.01 vs KO-NC group; *p < 0.01 vs WT-NC group; △p < 0.05 vs KO-4HH group.
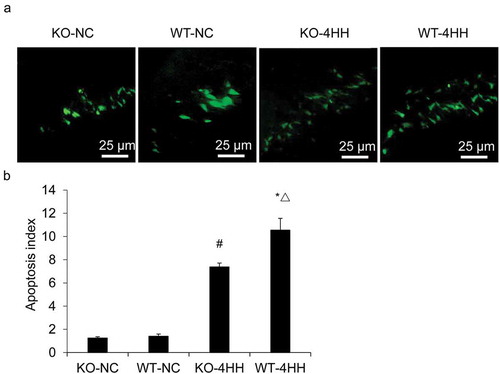
Figure 2. Apoptosis analysis of mouse hippocampus cells.
Caspase-3 activity of hippocampus in various groups. #p < 0.01 vs KO-NC group; *p < 0.01 vs WT-NC group; △p < 0.05 vs KO-4HH group.
Figure 3. qPCR Analysis of Bcl-2 and Bax mRNA expression in mouse hippocampus tissues.
Expression of Bcl-2 mRNA and Bax mRNA in mouse hippocampus tissues of various groups. #p < 0.01 vs KO-NC group; *p < 0.01 vs WT-NC group; △p < 0.05 vs KO-4HH group.
Figure 4. Western blot analysis of the expression of p38MAPK and P-p38MAPK protein in hippocampus of various groups.
#p < 0.01 vs KO-NC group; *p < 0.01 vs WT-NC group; △p < 0.05 vs KO-4HH group.