Figures & data
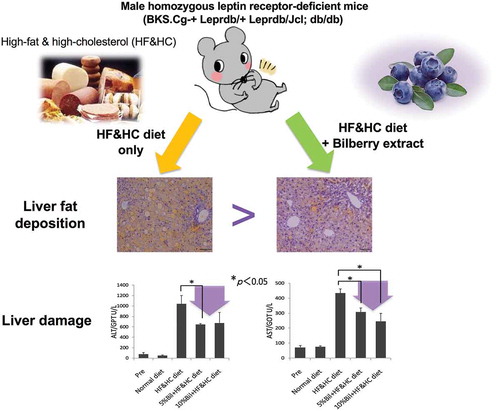
Table 1. Primer list for the quantitative real-time PCR (qRT-PCR).
Figure 1. Bilberry fruits extracts (BEs) improved steatotic hepatocyte growth (survival/proliferation) (AML12 cells). (a) Administration of free fatty acids (FA) consisting of 100 μM oleic and linoleic acids or 1 μM T0901317 (T090, an agonist for LXRα) induced substantial lipid deposition in murine AML12 hepatocytes (Day 5). Right panel: lipids in cytosol and nuclei stained with AdipoRed (green) and Hoechst33342 (red, pseudo-color), respectively. Scale bar: 50 μm. Different letters indicate statistically significant differences among groups (p < 0.05); n = 4; mean ± SEM. (b) Cell growth deteriorated similarly in both FA- and T090-induced steatotic hepatocytes. The same letter or no letter indicates that the difference is not significant within each time-point group (p < 0.05); n = 3–4; mean ± SEM). (c) BEs promoted cell growth of steatotic hepatocytes induced by FA- and T090-administration (left and right panels, respectively) with a peak concentration at 5 μg/mL. Since no significant difference in cell growth was observed between 12 h and 48 h, only the data after 60 h are shown. The same letter or no letter indicates that the difference is not significant within each time-point group (p < 0.05); n = 3–4; mean ± SEM.
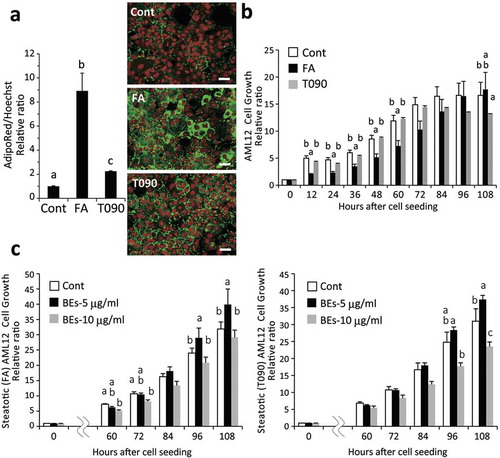
Figure 2. Bilberry fruits extracts (BEs) reduced lipid deposition in steatotic hepatocytes, promoted cell growth, and conferred resistance to oxidative stress. (a) BEs significantly suppressed lipid accumulation in hepatocytes. Right panel: lipids in cytosol and nuclei in green (AdipoRed) and red (Hoechst33342, pseudo-color), respectively. Scale bar: 50 μm. Different letters indicate statistically significant differences among groups (p < 0.05); n = 4–6; mean ± SEM. (b) BEs promoted cell growth at peak concentrations of 1–5 μg/mL in non-steatotic hepatocytes. The same letter indicates that the difference is not significant (p ≥ 0.05); n = 3–6). (c) BEs conferred resistance to a 24-h H2O2 challenge (500 μM) in hepatocytes. Lower panel: more live cells were observed in BEs-treated hepatocytes (1 μg/mL) than untreated liver cells. Scale: 50 μm. The same letter indicates that the difference is not significant (p ≥ 0.05); n = 3–6). (d) BEs did not directly react with and/or scavenge cellular ROS (left panel; n = 8).
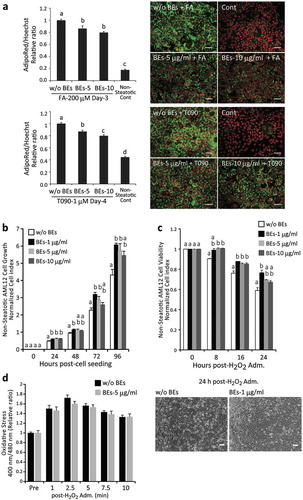
Table 2. Body weight and food intake in mice fed a high-fat and high-cholesterol (HF&HC) diet with/without bilberry fruits extracts (BEs) for 8 weeks. Data are means ± SEM; n = 4–8 per group. *p < 0.05 vs. HF&HC group. There were no significant differences in initial body weight or food intake between groups.
Figure 3. Bilberry fruits extracts (BEs) improved liver steatosis, liver damage, and hyperglycemia in mice fed HF&HC diets. (a) HF&HC diet (8 weeks) induced liver mass enlargement with no increase in body weight. The same letter indicates that the difference is not significant (p ≥ 0.05); n = 4. (b) BEs improved hepatic steatosis. Scale bar: 100 μm. Hepatic TG levels were reduced in BEs-treated livers (right panel). The same letter indicates that the difference is not significant (p ≥ 0.05); n = 4. (c) Fibrosis stained blue with Azan and was observed in the periportal area (arrowhead) of HF&HC-treated livers. (d) Blood biochemistry revealed that BEs improved steatosis-induced liver damage (ALT and AST) and hypercholesterolemia (total cholesterol, T-CHO). The same letter indicates that the difference is not significant within each group (p ≥ 0.05); n = 4. Mean ± SEM.
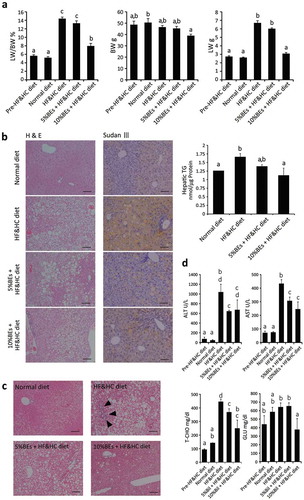
Figure 4. Molecular analyses of the effects of bilberry fruits extracts (BEs) on murine AML12 hepatocytes. (a) Effects of BEs on autophagy (lipophagy) (Rubicon, p62/SQSTM1) and fatty acid (FA) synthesis (fatty acid synthase, FASN) were examined in FA-/T0901317 (T090; LXRα agonist)-treated AML12 cells by western blot. Each blot represents ≥3 independent experiments. The duplicates of immunoblots are taken from the specimens of experiments performed at different times. ImageJ (NIH, Bethesda, MD, USA) was used for the quantitative analysis of western blot. The same letter indicates that the difference is not significant among groups (p ≥ 0.05). (b) Effects of BEs on FA synthesis were examined by qRT-PCR. The same letter indicates that the difference is not significant among groups (p ≥ 0.05). (c) Levels of proteins associated with autophagy, survival/proliferation, and antioxidant properties were slightly increased by the addition of BEs in non-steatotic AML12 cells (Day 3 and/or Day 7). Each blot represents ≥3 independent experiments. Each experiment was performed 3× and the data are expressed as means ± SEM (a, b, and c). The same letter or no letter indicates that the difference is not significant within each time-point group (p ≥ 0.05).