894
Views
25
CrossRef citations to date
0
Altmetric
Biochemistry & Molecular Biology

Inhibitory effects of a sulfated polysaccharide isolated from edible red alga Bangia fusco-purpurea on α-amylase and α-glucosidase

, , , , , , & show all
Pages 2065-2074 | Received 25 Apr 2019, Accepted 14 Jun 2019, Published online: 27 Jun 2019

Figures & data

Figure 1. Purification and characterization of BFP.

(a) Elution profile of polysaccharide fraction extracted from B. fusco-purpurea on a Sephadex G75 column. (b) TLC pattern of BFP developed with n-butanol/glacial acetic acid/water, 2: 2: 1, v/v/v. The first line (a line) is the solvent front, and the second line (b line) is the origin. (c) Profile of BFP in HPLC on a TSK-gel G4000 PWXL column (7.8 mm I.D. × 300 mm) eluted with ultra-pure water (pH = 7.0) at a flow rate of 1.0 mL/min. (d) FT-IR spectrum of BFP.
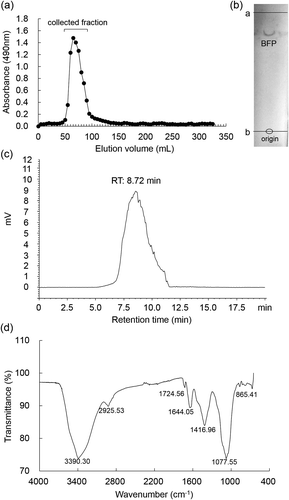
Figure 1. Purification and characterization of BFP.(a) Elution profile of polysaccharide fraction extracted from B. fusco-purpurea on a Sephadex G75 column. (b) TLC pattern of BFP developed with n-butanol/glacial acetic acid/water, 2: 2: 1, v/v/v. The first line (a line) is the solvent front, and the second line (b line) is the origin. (c) Profile of BFP in HPLC on a TSK-gel G4000 PWXL column (7.8 mm I.D. × 300 mm) eluted with ultra-pure water (pH = 7.0) at a flow rate of 1.0 mL/min. (d) FT-IR spectrum of BFP.

Table 1. Chemical compositions and molecular mass of polysaccharide isolated from B. fusco-purpurea.

Figure 2. Inhibitory effects of BFP on α-amylase and α-glucosidase.

(a) Inhibitory effects of BFP (0–1.0 mg/mL) or acarbose (0.01 mg/mL) on α-amylase. (b) Inhibitory effects of BFP (0–1.0 mg/mL) or acarbose (0.50 mg/mL) on α-glucosidase. All experiments were performed in triplicate, and values are the means ± SD. Asterisks indicate significant differences between with and without polysaccharides (or acarbose). *p <0.05.
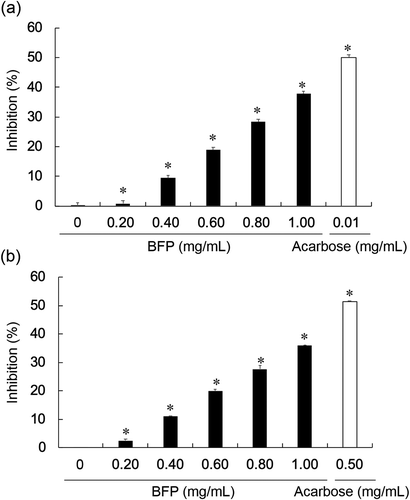
Figure 2. Inhibitory effects of BFP on α-amylase and α-glucosidase.(a) Inhibitory effects of BFP (0–1.0 mg/mL) or acarbose (0.01 mg/mL) on α-amylase. (b) Inhibitory effects of BFP (0–1.0 mg/mL) or acarbose (0.50 mg/mL) on α-glucosidase. All experiments were performed in triplicate, and values are the means ± SD. Asterisks indicate significant differences between with and without polysaccharides (or acarbose). *p <0.05.

Figure 3. The inhibitory kinetics of BFP on α-amylase and α-glucosidase.

(a) Linear regression of reaction rates versus different concentrations of α-amylase in the presence (closed circles) and absence (open circles) of BFP. The final concentration of starch was 5.0 mg/mL, and the reaction time was 3 min. (b) Linear regression curves of reaction rates versus different concentrations of α-glucosidase in the presence (closed circles) and absence (open circles) of BFP. The final concentration of pNPG was 2.5 mM, and the reaction time was 3 min. (c) Lineweaver–Burk plot of the reactions of α-amylase in the presence (closed circles) and absence (open circles) of BFP. (d) Lineweaver–Burk plot of the reactions of α-amylase in the presence (closed circles) and absence (open circles) of BFP. All experiments were performed in triplicate, and values were the means ± SD.
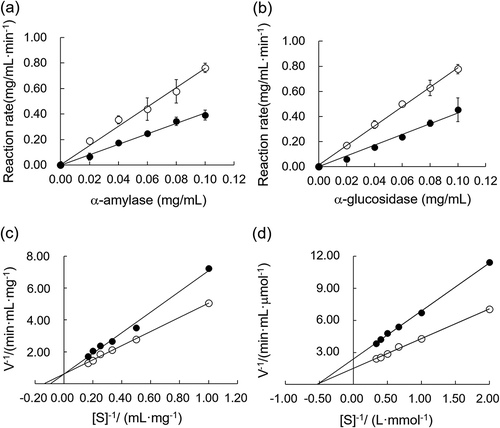
Figure 3. The inhibitory kinetics of BFP on α-amylase and α-glucosidase.(a) Linear regression of reaction rates versus different concentrations of α-amylase in the presence (closed circles) and absence (open circles) of BFP. The final concentration of starch was 5.0 mg/mL, and the reaction time was 3 min. (b) Linear regression curves of reaction rates versus different concentrations of α-glucosidase in the presence (closed circles) and absence (open circles) of BFP. The final concentration of pNPG was 2.5 mM, and the reaction time was 3 min. (c) Lineweaver–Burk plot of the reactions of α-amylase in the presence (closed circles) and absence (open circles) of BFP. (d) Lineweaver–Burk plot of the reactions of α-amylase in the presence (closed circles) and absence (open circles) of BFP. All experiments were performed in triplicate, and values were the means ± SD.

Table 2. Effects of BFP on the secondary structures of α-amylase and α-glucosidase.

Figure 4. Effects of BFP on the CD spectrum of α-amylase or α-glucosidase.

CD spectra of α-amylase (a) or α-glucosidase at 5.0 mg/mL (b) in the presence (dotted line) or absence (solid line) of BFP (1000 µg/mL) were measured. Measurements were carried out after 15 min incubation of the mixture of enzyme and BFP at 25°C.
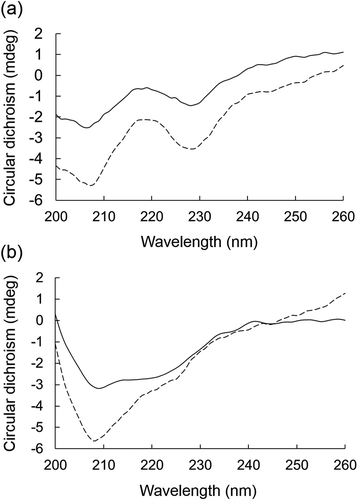
Figure 4. Effects of BFP on the CD spectrum of α-amylase or α-glucosidase.CD spectra of α-amylase (a) or α-glucosidase at 5.0 mg/mL (b) in the presence (dotted line) or absence (solid line) of BFP (1000 µg/mL) were measured. Measurements were carried out after 15 min incubation of the mixture of enzyme and BFP at 25°C.

Figure 5. Effects of BFP on the fluorescence spectrum of α-amylase or α-glucosidase.

Fluorescence emission spectra of α-amylase (a) or α-glucosidase (b) at 1.0 mg/mL in the presence (dotted line) or absence (solid line) of BFP (1000 µg/mL) were measured. Measurements were carried out after 15 min incubation of the mixture of enzyme and BFP at 25°C. Fluorescence emission spectrum of BFP alone (c) at 1000 µg/mL.
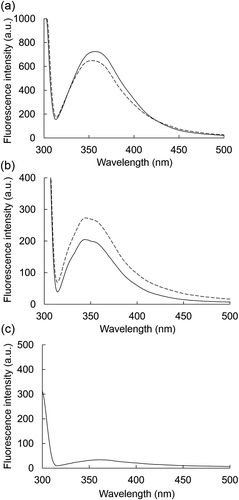
Figure 5. Effects of BFP on the fluorescence spectrum of α-amylase or α-glucosidase.Fluorescence emission spectra of α-amylase (a) or α-glucosidase (b) at 1.0 mg/mL in the presence (dotted line) or absence (solid line) of BFP (1000 µg/mL) were measured. Measurements were carried out after 15 min incubation of the mixture of enzyme and BFP at 25°C. Fluorescence emission spectrum of BFP alone (c) at 1000 µg/mL.
Supplemental material

Supplemental Material

Download MS Word (16.1 KB)

Figure S2. HPLC analysis of monosaccharide compositions of BFP. Elution profiles of PMP-derived monosaccharide standards (a) and PMP-derived acid-hydrolyzed BFP (b).

Download TIFF Image (474.9 KB)

Figure S1. The calibration curve of dextrans by HPLC on a TSK-gel G4000 PW<sub>XL</sub> column (7.8 mm I.D. × 300 mm) eluted with 0.1 M Na<sub>2</sub>SO<sub>4</sub> solved in PBS (pH = 6.8) at a flow rate of 1.0 mL/min.

Download TIFF Image (113.9 KB)

Reprints and Corporate Permissions

Please note: Selecting permissions does not provide access to the full text of the article, please see our help page How do I view content?

To request a reprint or corporate permissions for this article, please click on the relevant link below:

Academic Permissions

Please note: Selecting permissions does not provide access to the full text of the article, please see our help page How do I view content?

Obtain permissions instantly via Rightslink by clicking on the button below:

If you are unable to obtain permissions via Rightslink, please complete and submit this Permissions form. For more information, please visit our Permissions help page.