Figures & data
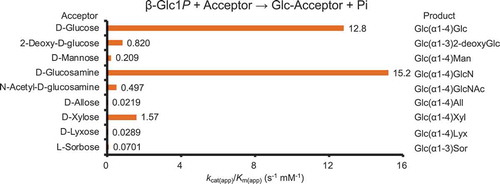
Figure 1. Kinetic scheme of the reverse phosphorolysis.
Figure 2. Effects of pH and temperature.
(a) pH activity curve. Reaction buffers are sodium citrate buffer (open circles), MES-NaOH buffer (close circles), HEPES-NaOH buffer (open squares), and glycine-NaOH buffer (close squares). (b) Temperature activity curve. (c) pH stability. Residual activity after the pH treatment at 4°C for 24 h is shown. (d) Temperature stability. Residual activity after the heat treatment for 15 min is shown. Values and error bars are average and standard deviation of three independent experiments.
Figure 3. Double reciprocal plots for phosphorolysis of maltose by MalE.
Maltose concentrations were 0.5 mM (closed circles), 1.0 mM (open circles), 2.0 mM (closed triangles), and 4.0 mM (open triangles). Values and error bars are average and standard deviation of three independent experiments.
Table 1. Apparent kinetic parameters for reverse phosphorolysis with various acceptor substrates.
Table 2. Chemical shifts of oligosaccharides produced through the reverse phosphorolysis in the 1H- and 13C- NMR spectra.
Figure 4. Predicted substrate binding structure of MalE.
(a) Superimposition of model structure of MalE (magenta) and C. saccharolyticus kojibiose phosphorylase (PDB entry, 3WIQ; green). Glucosyl residue bound to subsite −1 of the kojibiose phosphorylase is shown in cyan. α-d-Glucose (PDB entry, AGC), shown in yellow, is superimposed onto d-glucose residue of kojibiose in subsite +1 (this d-glucose residue is not shown in this panel). Dotted line indicates predicted hydrogen bonds. (b) Superimposition of α-d-glucose (yellow) and the reducing end d-glucose residue of kojibiose. (c) Surface model of MalE. α-d-Glucose bound to subsite +1 is shown in the yellow stick representation. The amino acid residues forming subsite +1 are shown in magenta.
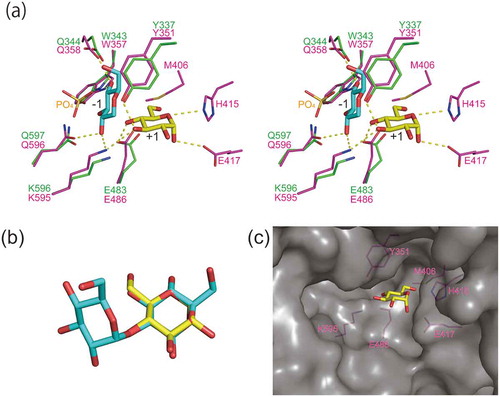
Figure 5. Possible reaction mechanisms of reverse phosphorolysis.
Possible reaction mechanisms of reverse phosphorolysis with α-d-glucose (a), 2-deoxy-d-glucose (b), and α-l-sorbopyranose (c) are shown.