Figures & data
Figure 1. Protective effect of acteoside and isoacteoside on glutamate-induced cytotoxicity in PC12 cells. (a) Chemical structure of acteoside and isoacteoside. (b) Effects of acteoside and isoacteoside on the cell viability measured by MTT assay. Values represent mean ± SD of 3 independent experiments. #p < 0.05 vs control, *p < 0.05, **p < 0.01 vs glutamate group.
Figure 2. Effects of acteoside and isoacteoside on glutamate-induced apoptosis in PC12 cells. Cells were incubated with indicated concentrations of acteoside and isoacteoside for 12 h before exposure to 10 mM glutamate for 24 h. (a-d), Nuclear morphological changes in the cells were observed after Hoechst 33342 staining in control (a), glutamate (b), glutamate+acteoside (c) and glutamate+isoacteoside (d) groups. (e), DNA degradation with agarose gel electrophoresis analysis. Lane 1: DNA marker; Lane 2: normal; Lane 3: glutamate; Lane 4, 5: pre-incubated 12 h with 100 μM acteoside and isoacteoside and then treated with glutamate for 24 h. (f), Representative patterns of flow cytometric distribution of PC12 cells after Annexin V-PI double staining and the quantitative analysis of apoptotic cells. ##p < 0.01 vs the control group. **p < 0.01 vs glutamate group.
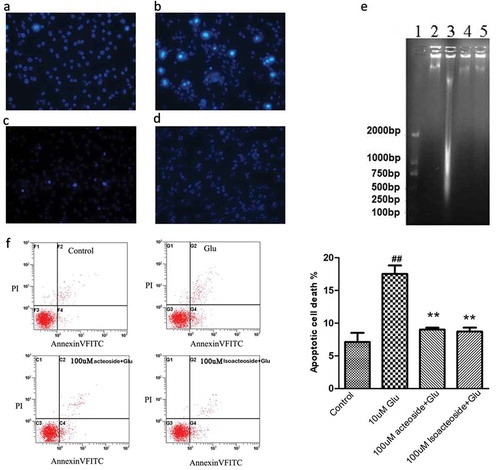
Table 1. Effects of acteoside and Isoacteoside on lipid peroxidation and antioxidant enzyme activities in PC12 cells.
Figure 3. Effect of acteoside and isoacteoside on glutamate-induced changes of ROS level and concentration of Ca2+ in PC12 cells. (a), Effects of acteoside and isoacteoside on production of intracellular ROS. (b), Effect of acteoside and isoacteoside on the concentration of Ca2+ in glutamate-treated PC12 cells. Values represent mean ± SD; ##P < 0.01 vs control group; *P < 0.05, **P < 0.01 vs glutamate group.
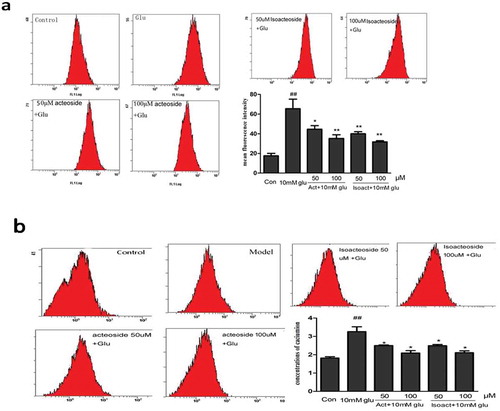
Figure 4. Effects of acteoside and isoacteoside on the changes of protein expression induced by glutamate in PC12 cells. (a), Assessment of Bcl-2, Bax protein levels and the ratio of Bax/Bcl-2 by western blotting. (b), Relative level of activated caspase-3 subunit. ##P < 0.01 vs control; *P < 0.05, **P < 0.01 vs glutamate group.
Table 2. Protective effect of acteoside against Y-maze test in glutamate-induced amnesia.
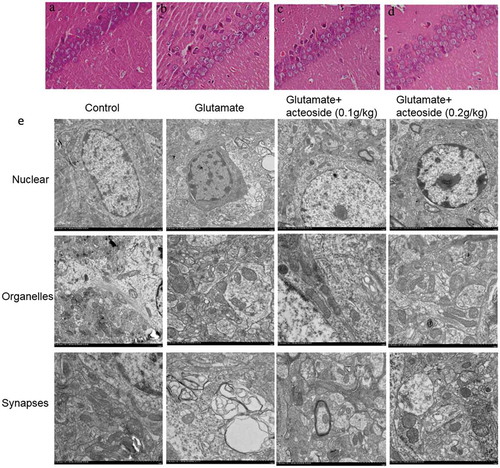
Figure 5. Effect of acteoside on morphological changes of CA1 neuron in hippocampus. (a-d), representative images obtained by HE staining (400×) of control group (a), glutamate group (6 g/kg) (b), glutamate+ acteoside (0.1 g/kg) group (c), and glutamate+ acteoside (0.2 g/kg) group (d). (e), ultrastructural images of nuclei (upper), organells (middle) and synapse (below) in CA1 region of mice from control group, glutamate group (6 g/kg), glutamate+ acteoside (0.1 g/kg) group, and glutamate+ acteoside (0.2 g/kg) group (from left to right).