Figures & data

Figure 1. MiR-29a-3p was down-expression in CRC.
Quantitative reverse transcription PCR was performed to examine the expression level of miR-29a-3p in ten pairs of CRC tissue samples compared with matched adjacent tissues (a, *p < 0.05, ***p < 0.001) and different cell lines (b, **p < 0.01, ***p < 0.001).
Figure 2. MiR-29a-3p regulated CRC proliferation, cell cycle progression and apoptosis.
(a) Relative expression levels of miR-29a-3p were measured by quantitative reverse transcription PCR in DLD-1 and SW480 cells transfected with miR-29a-3p mimic or miR-NC. (b) Cell proliferation was analyzed via a CCK-8 assay. (c) Flow-cytometric determination of the proportion of cells in each cell cycle phase in DLD-1 and SW480 cells transfected with miR-29a-3p mimic or miR-NC. (d) The percentages of apoptosis cells were measured by flow cytometry in DLD-1 and SW480 cells transfected with miR-29a-3p mimic or miR-NC. *p < 0.05, **p < 0.01, ***p < 0.001 vs. miR-NC
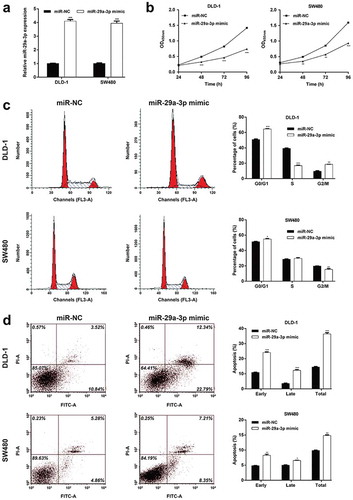
Figure 3. MiR-29a-3p targets RPS15A in CRC cells.
(a) A diagram for the RPS15A 3′-UTR fragment containing the WT or MUT miR-29a-3p binding site was displayed. We constructed pmirGLO-RPS15A-3′UTR-WT and pmirGLO-RPS15A-3′UTR-MUT plasmids to perform luciferase reporter assay. Luciferase reporter assay indicated that miR-29a-3p could directly bind to RPS15A 3′UTR in (b) DLD-1 and (c) SW480 cells. *p < 0.05, **p < 0.01 vs. miR-NC; (d) Western blot results suggested that miR-29a-3p overexpression decreased RPS15A protein level in DLD-1 and SW480 cell lines. (e) Western blot analysis of RPS15A protein level in four CRC cell lines (DLD-1, RKO, SW480 and HCT116 cells) and the normal colon epithelial cells FHC
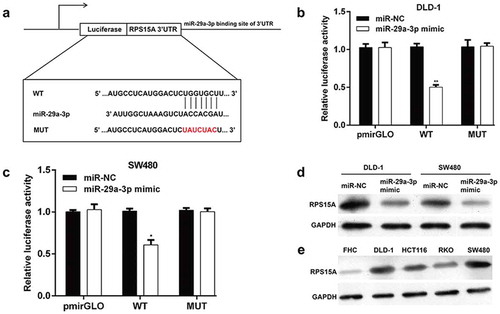
Figure 4. RPS15A can rescue the phenotypic changes caused by miR-29a-3p in DLD-1 cells.
(a) RPS15A protein expression was measured by western blot in DLD-1 cells co-transfected with miR-29a-3p mimic/miR-NC and with RPS15A overexpression plasmid/empty vector. GAPDH was used as an internal control. (b-d) Cell proliferation, cell cycle distribution and apoptosis were determined in DLD-1 cells co-transfected with miR-29a-3p mimic/miR-NC and with RPS15A overexpression plasmid/empty vector. *p < 0.05, **p < 0.01, ***p < 0.001 vs. miR-29a-3p mimic + Vector
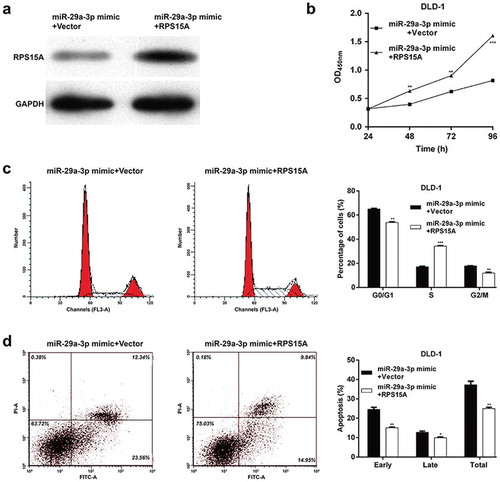
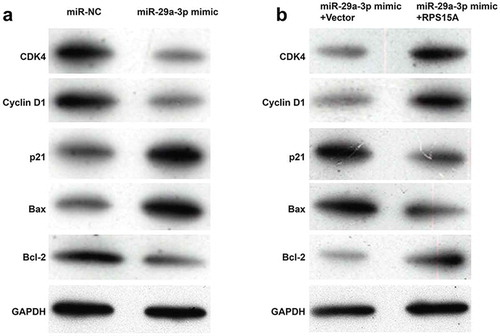
Figure 5. RPS15A counteracted the effects of miR-29a-3p on cell cycle and apoptotic markers.
(a) The cell cycle and apoptotic markers were detected in DLD-1 cells transfected with miR-29a-3p mimic or miR-NC using western blotting. (b) The cell cycle and apoptotic markers were detected in DLD-1 cells co-transfected with miR-29a-3p mimic/miR-NC and with RPS15A overexpression plasmid/empty vector using western blotting. GAPDH was used as an internal control.