
Figures & data
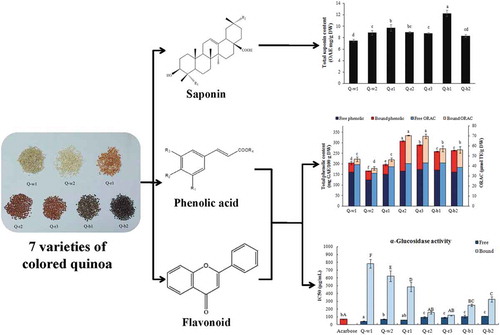
Figure 1. Representative photographs in appearance and the sample code of 7 colored quinoa varieties.
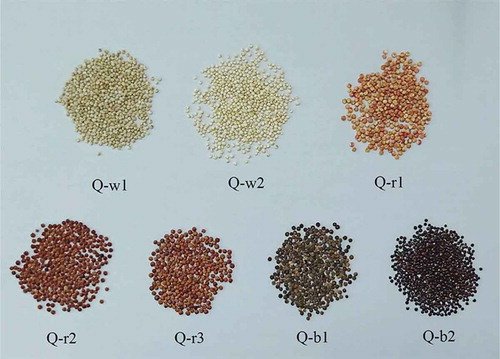
Figure 2. The total saponin content of 7 colored quinoa varieties. Error bars correspond to the standard deviation (n = 3). Values with different letters are significantly different (p < 0.05). OAE: oleanolic acid equivalents; DW: dry weight.
Table 1. The total phenolic and flavonoid contents of 7 colored quinoa varieties and the contribution (%) of free and bound fractions to the total content.
Table 2. Phenolic compounds of 7 colored quinoa varieties and the contribution (%) of free and bound fractions to the total content of each phenolic compound.
Table 3. Antioxidant activity of 7 colored quinoa varieties evaluated through the ORAC and FRAP assays and the contribution (%) of free and bound fractions to total antioxidant activity.
Table 4. The Pearson’s correlation coefficients between the phenolic compounds of 7 colored quinoa varieties and their antioxidant activity.
Figure 3. Inhibition activity of (a) free and (b) bound phenolic extracts from 7 colored quinoa varieties against α-glucosidase. Error bars correspond to the standard deviation (n = 3).
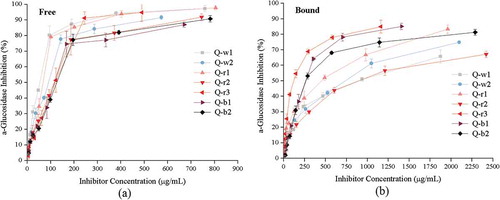
Table 5. IC50 values of α-glucosidase inhibition by free and bound phenolic extracts from 7 colored quinoa varieties.
Table 6. The Pearson’s correlation coefficients between the phenolic compounds of 7 colored quinoa varieties and their IC50 values of α-glucosidase inhibitory activity.