Figures & data
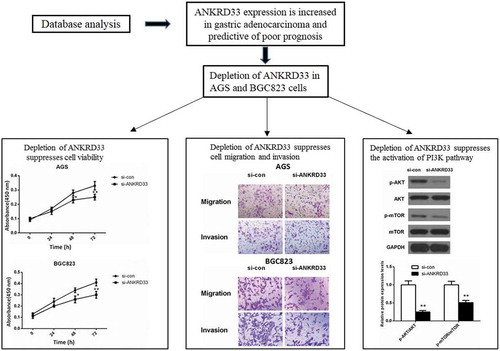
Table 1. The association between ANKRD33 expression and the clinical features. *p < 0.05.
Figure 1. ANKRD33 expression was enhanced in gastric adenocarcinoma. (a) The mRNA expression of ANKRD33 was up-regulated in gastric adenocarcinoma tissues (n = 375) compared with that in the normal gastric tissues (n = 32). The expression data of these samples were downloaded from TCGA database. (b) Survival curves of ANKRD33 gene. Samples were divided into high (n = 176) and low expression (n = 175) group according to the median of ANKRD33 expression. (c) The mRNA expression of ANKRD33 in gastric adenocarcinoma cell lines were analyzed by qPCR. **p < 0.01vs.GES1.
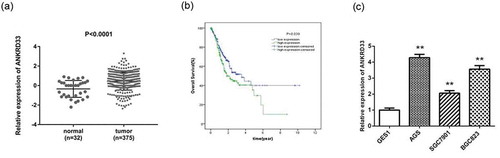
Figure 2. Detection of knockdown efficiency of NKRD33. (a) The mRNA expression of ANKRD33 in AGS cells was determined by qPCR. (b) The protein expression of ANKRD33 in AGS cells was determined by Western blot. (c) Quantification the protein expression levels in Figure (b). **p < 0.01vs. si-con.
Figure 3. The proliferation ability of AGS and BGC823 cells was determined by CCK8 assay. (a) Knockdown of NKRD33 significantly suppressed AGS cell proliferation. (b) Knockdown of NKRD33 significantly suppressed BGC823 cell proliferation. *p < 0.05, **p < 0.01 vs. si-con group.
Figure 4. The migration and invasion ability of AGS and BGC823 cells was determined by transwell assays. (a) Representative images of the migrated and invaded AGS cells. (b) The numbers of migrated and invaded AGS cells. (c) Representative images of the migrated and invaded BGC823 cells. (d) The numbers of migrated and invaded BGC823 cells. **p < 0.01 vs. si-con group. Bar = 200 µm.
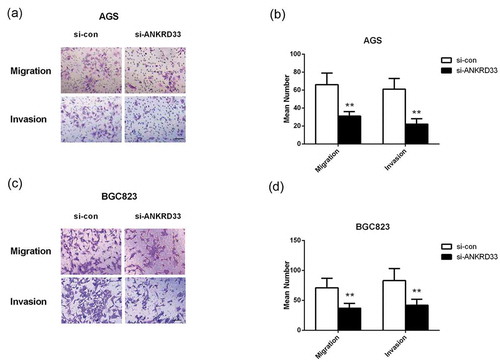
Figure 5. The expression levels of PI3K signaling pathway-related proteins in AGS cells were determined by Western blot. (a) The protein expression of AKT, p-AKT, mTOR and p-mTOR in AGS cells with depleted NKRD33 was determined by Western blot. (b) Quantification of the protein expression levels in Figure (a). **p < 0.01 vs. si-con group.