Figures & data
Figure 1. Comparison of microbiota in healthy volunteers (HC) and patients with Alzheimer’s disease (AD).
(a) Principal coordinate analysis of microbiotas from 14 healthy volunteers (blue) and 13 patients (red). Fecal samples AD35 and HC49 were selected for transplantation. (b) Principal coordinate analysis clearly separates healthy and affected volunteers based on UniFrac distance. Data are mean ± SEM. ***, p < 0.001 by Mann-Whitney U test.
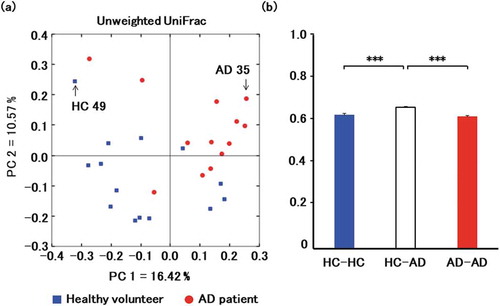
Figure 2. Changes in the gut microbiota of a model mouse of Alzheimer’s disease. Time-dependent changes in bacterial phyla of Firmicutes (a), Bacteroidetes (b), Verrucomicrobia (c), and Proteobacteria (d) in mice transplanted with microbiota from a healthy volunteer (blue) and from a patient with Alzheimer’s disease (red).
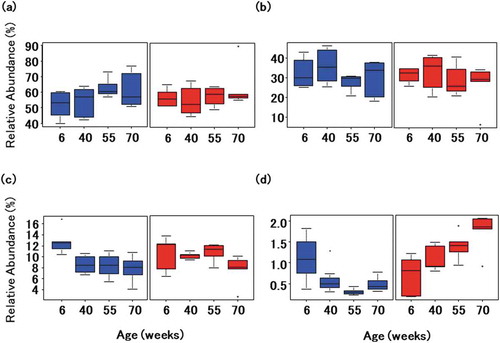
Figure 3. Gut microbial composition over time in mice transplanted with microbiotas from healthy and affected donors.
(a) Principal coordinate analysis of weighted UniFrac distances. Data points are individual mice colored by donor microbiota and age in weeks. (b) Shannon index by age and donor microbiota.
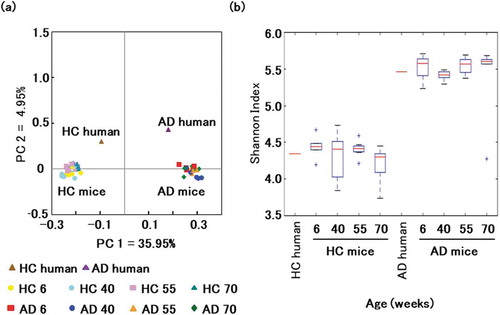
Figure 4. Novel object recognition test.
(a) Design of object location test (OLT) and object recognition test (ORT). (b) Ratio of time spent exploring a familiar object in a new location to time spent exploring a familiar object in an old location. Blue, mice transplanted with microbiota from a healthy donor. * and ** indicate comparison between groups and significant differences were observed at 55 and 70 weeks of age; red, mice transplanted with microbiota from a patient with Alzheimer’s disease. Red bar, Mice transplanted with microbiota from a patient with Alzheimer’s disease had significantly altered cognitive function at 70 and 75 weeks of age compared with that at 10 weeks of age. (c) Ratio of time spent exploring a novel object to time spent exploring a familiar object. Blue, mice transplanted with microbiota from a healthy donor. * and ** indicate comparison between groups and significant differences were observed at 30, 55, 60, 65 and 70 weeks of age; red, mice transplanted with microbiota from a patient with Alzheimer’s disease. Red bar, Mice transplanted with microbiota from a patient with Alzheimer’s disease had significantly altered cognitive function at 70 weeks of age compared with that at 10 weeks of age. Data are mean ± SEM. *, p < 0.05; **, p < 0.01.
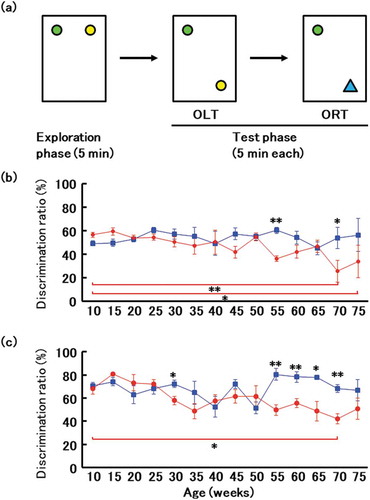
Figure 5. Comparison of metabolites in mouse feces.
Principal component analysis of microbial metabolites in mice transplanted with microbiotas from a healthy volunteer (blue) and from a patient with Alzheimer’s disease (red).
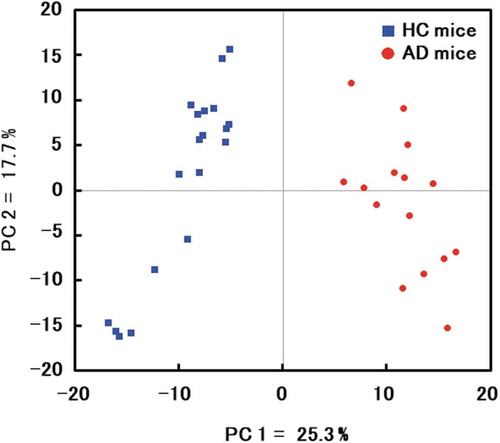
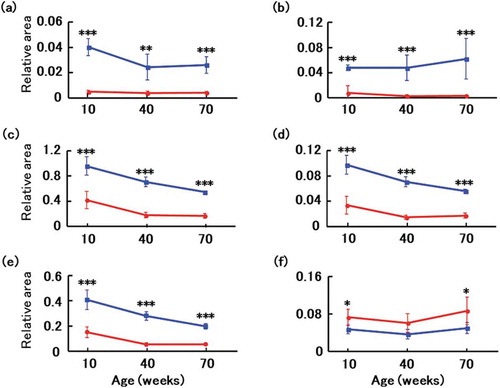
Figure 6. Changes in fecal metabolites of recipient mice.
Fecal metabolomes of GABA (a), taurine (b), valine (c), tryptophan (d), tyrosine (e), and propionic acid (f) were surveyed at age 10, 40, and 70 weeks in mice transplanted with microbiotas from a healthy volunteer (blue) and a patient with Alzheimer’s disease (red). Data are mean ± SD. *, p < 0.05; **, p < 0.01; ***, p < 0.001 by t test.