Figures & data
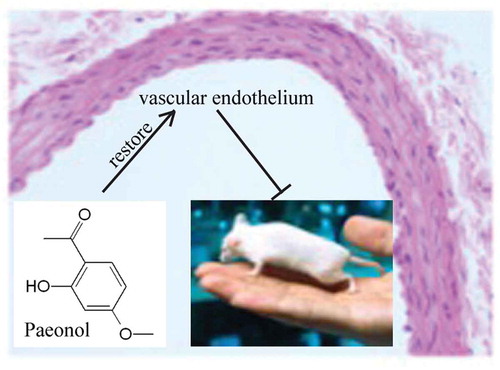
Table 1. Mean arterial pressure (mmHg) in various groups after 12 weeks.
Figure 1. The blood pressure measurement of each group at different time point. (a) Systolic blood pressure. (b) Diastolic blood pressure. N = 10, Different alphabets indicated significant differences.
Table 2. Cerebral blood flow in various groups after 12 weeks.
Table 3. Hemorheology indexes in various groups after 12 weeks.
Figure 2. The content of serum SOD (a) and MDA (b) in each group. N = 10, Different alphabets indicated significant differences.
Figure 3. Serum levels of vWF (a), NO (b), AT1 (c), and ET-1 (d) in different groups of rats. N = 10, Different alphabets indicated significant differences.
Figure 4. Structure of the vascular endothelium determined by HE staining in the group of WKY (a), SHR (b), LSHRT (c) and HSHRT (d). N = 10, scale bar = 100 μm.
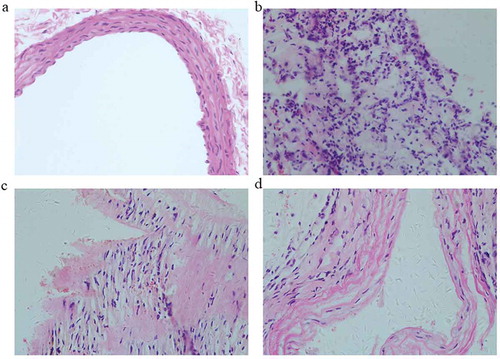
Figure 5. The protein expression of eNOS, NOX4, and VCAM-1 in different groups of rats. N = 10, Different alphabets indicated significant differences.