Figures & data
Figure 1. Changes in PEPC activity and accumulation of protein and oil in seeds of two cultivars, Enrei and Tamahomare, during seed maturation. A: amount of proteins per seed, B: PEPC activity per seed. Black and white circles indicate the cultivar, Enrei and Tamahomare, respectively. Error bar represents standard error (n = 3).
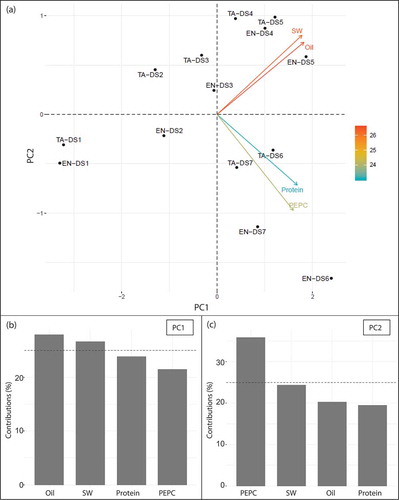
Figure 2. The results of PCA in seed compositions, protein, oil, seed weight and PEPC activities during seed maturation. Characters and numerals show the name of cultivars and stage of samples, respectively. The characters EN and TA indicate Enrei and Tamahomare, respectively. The numerals with DS indicate the stage of samples. A: a biplot of the two major principal components, representing a distribution of the samples analyzed. Marks in black indicate samples, and arrows indicate the directions of protein content (Protein), oil content (Oil), seed fresh weight (SW), and PEPC activity per seed (PEPC). Color of arrows indicate contributions of variances (%). Horizontal- and vertical- axes represent principal component 1 (PC1) and principal component 2 (PC2), respectively. PC1 and PC2 explain 73.6 and 16.4% of the data variances, respectively. B and C: contributions of the variables on PC1 and PC2, respectively. Dot lines indicate the averaged values.