Figures & data
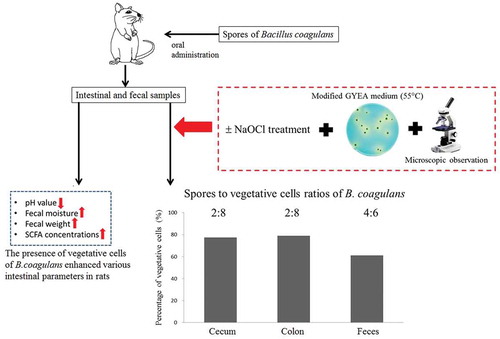
Figure 1. Colony morphology of pure Bacillus coagulans cultured on the modified GYEA medium and their micrographs after 4–6 d of incubation.
*Spores of B. coagulans were pointed by red arrows.
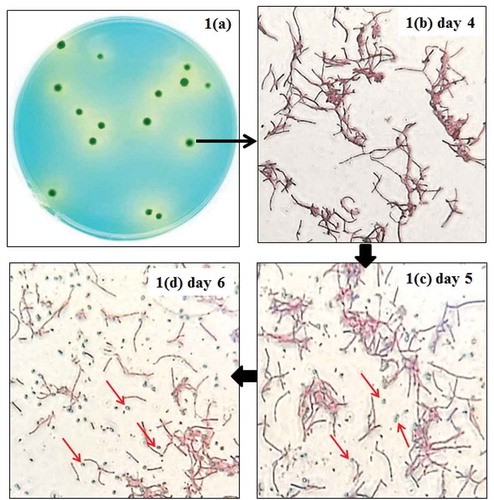
Figure 2. Percentages of spore-bearing colonies over the total colonies of Bacillus coagulans with yellow ring on the modified medium at different incubation times.
Bars (mean ± SD, n = 3) with different letters are significantly different (p < 0.05).
*Day 0 refers to the time point of inoculation prior to incubation.
Table 1. The numbers of Bacillus coagulans spores and vegetative cells in feces after the consumption of B. coagulans spores.
Figure 3. The ratios of Bacillus coagulans spores and vegetative cells at different intestinal sections.
a-bPercentages of spore numbers (mean ± SD, n = 8) among different bars with different superscripts are significantly different (p < 0.05).
c-dPercentages of vegetative cell numbers (mean ± SD, n = 8) among different bars with different superscripts are significantly different (p < 0.05).
Table 2. Differences of fecal moisture, fecal weight, and fecal pH in rats fed diets with or without Bacillus coagulans spores.
Figure 4. Differences in the fecal short-chain fatty acids between the control and BC groups.
Bars (mean ± SD, n = 8) of each fatty acid denoted with * differ from its corresponding control group significantly (p < 0.05).