Figures & data
Figure 1. Berberine derivatives and human RMS cells.
(a) The structural formula of berberine derivatives. (b) 2D-cultured human RMS cells. Scale bar, 100 μm. (c) qPCR results of gene expression in RMS cells treated with 10 or 100 μM of berberine or palmatine for 24 h. The mean value in control RMS cells was set at 1.0 for each gene. There was no significant difference among samples in any RMS cells (Scheffe’s F test). n = 3.
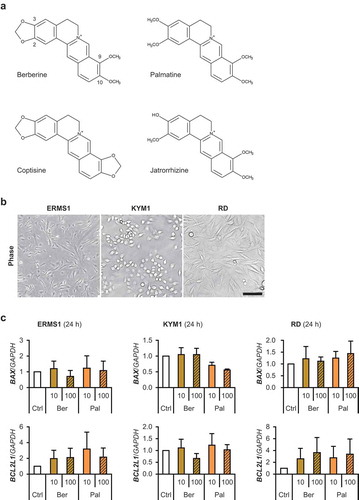
Table 1. Primer sequences for qPCR.
Figure 2. Effects of berberine and palmatine on ERMS1 cell growth.
(a) The number of ERMS1 cells treated with 1, 3, or 10 μM of berberine. * p < 0.05, ** p < 0.01 vs 0 μM at each time point (Williams’ test). n = 3. (b) The number of ERMS1 cells treated with 10 μM of berberine or palmatine. ** p < 0.01 vs control at each time point (Scheffe’s F test). n = 5. (c) Representative images of ERMS1 cells treated with 10 μM of berberine or palmatine for 96 h. Scale bar, 250 μm. (d) Representative images and the ratio of cell cycle phases of ERMS1 cells treated with 10 μM of berberine or palmatine for 24 h. Scale bar, 100 μm. ** p < 0.01 vs control, †† p < 0.01 vs berberine (Scheffe’s F test). n = 4. (e) Incorporation of berberine or palmatine into ERMS1 cells as 530 nm emission at 24 h after treatment at a concentration of 10 μM. Scale bar, 100 μm.
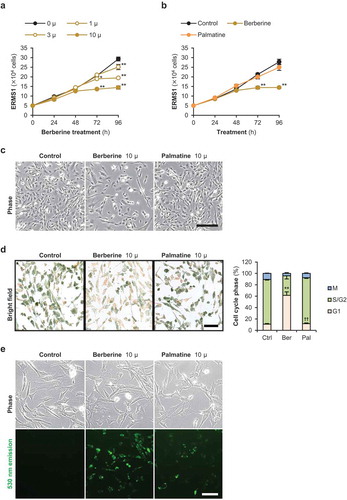
Figure 3. Effects of berberine and palmatine on KYM1 cell growth.
(a) The number of KYM1 cells treated with 1, 3, or 10 μM of berberine. * p < 0.05, ** p < 0.01 vs 0 μM at each time point (Williams’ test). n = 4. (b) The number of KYM1 cells treated with 10 μM of berberine or palmatine. ** p < 0.01 vs control at each time point (Scheffe’s F test). n = 4. (c) Representative images of KYM1 cells treated with 10 μM of berberine or palmatine for 72 h. Scale bar, 250 μm. (d) Representative images and the ratio of cell cycle phases of KYM1 cells treated with 10 μM of berberine or palmatine for 24 h. Scale bar, 100 μm. ** p < 0.01 vs control, †† p < 0.01 vs berberine (Scheffe’s F test). n = 4. (e) Incorporation of berberine or palmatine into KYM1 cells as 530 nm emission at 24 h after treatment at a concentration of 10 μM. Scale bar, 100 μm.
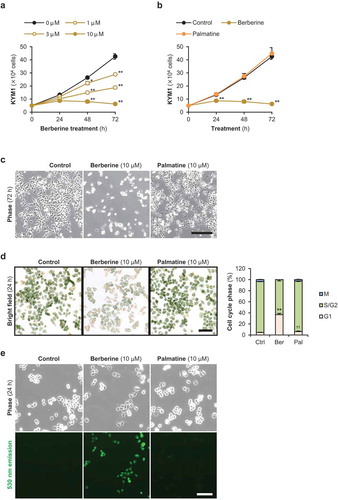
Figure 4. Effects of berberine and palmatine on RD cell growth.
(a) The number of RD cells treated with 1, 3, or 10 μM of berberine. ** p < 0.01 vs 0 μM at each time point (Williams’ test). n = 3. (b) The number of RD cells treated with 10 μM of berberine or palmatine. * p < 0.05 vs control, ** p < 0.01 vs control, †† p < 0.01 vs berberine at each time point (Scheffe’s F test). n = 4. (c) Representative images of RD cells treated with 10 μM of berberine or palmatine for 96 h. Scale bar, 250 μm. (d) Representative images and the ratio of cell cycle phases of RD cells treated with 10 μM of berberine or palmatine for 24 h. Scale bar, 100 μm. ** p < 0.01 vs control, †† p < 0.01 vs berberine (Scheffe’s F test). n = 4. (e) Incorporation of berberine or palmatine into RD cells as 530 nm emission at 24 h after treatment at a concentration of 10 μM. Scale bar, 100 μm.
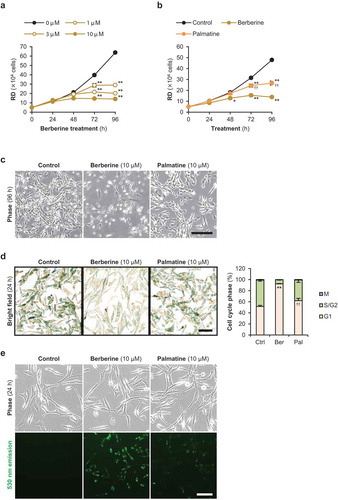
Figure 5.. Berberine inhibits cell cycle gene expression in RMS cells.
(a) qPCR results of gene expression in RMS cells treated with 10 μM of berberine or palmatine for 48 h (KYM1) or 72 h (ERMS1 and RD). The mean value in control RMS cells was set at 1.0 for each gene. * p < 0.05 vs control, ** p < 0.01 vs control, †† p < 0.01 vs berberine (Scheffe’s F test). n = 3–5. (b) Representative images of Western blotting and the quantified p57Kip2 protein levels in the ERMS1 cells treated with 10 μM of berberine or palmatine for 72 h. * p < 0.05 vs control (Scheffe’s F test). n = 3.
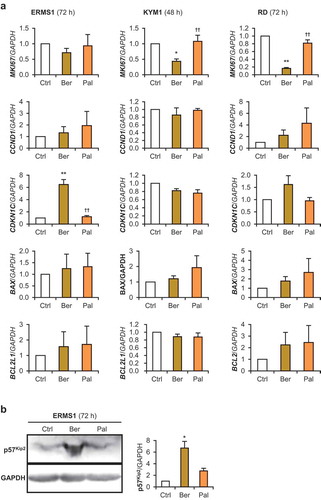
Figure 6. Effects of berberine and palmatine on RD tumorspheres.
(a) The growth of 3D-cultured RD tumorsphere. Scale bar, 200 μm. (b) Incorporation of berberine or palmatine into RD tumorspheres as 530 nm emission at 24 h after treatment at a concentration of 10 μM. Scale bar, 50 μm. (c) Projected areas of the RD tumorspheres treated with 10 μM of berberine or palmatine. The mean value of the control tumorspheres on day 0 was set at 1.0. ** p < 0.01 vs control (Scheffe’s F test). n = 4–8. (d) Representative images of the RD tumorspheres treated with 10 μM of berberine or palmatine for 8 days. Scale bar, 100 μm. (e) qPCR results of gene expression in RD tumorspheres treated with 10 μM of berberine or palmatine for 6 days. ** p < 0.01 vs control, †† p < 0.01 vs berberine (Scheffe’s F test). n = 3.
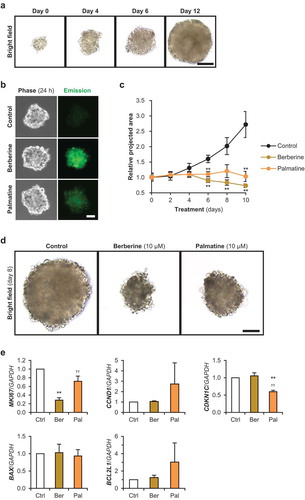
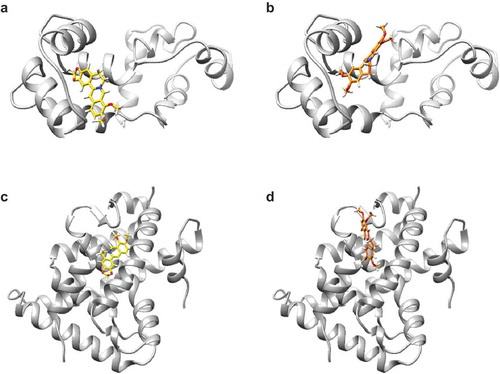
Figure 7. The simulated binding poses of berberine and palmatine on their target proteins.
(a,b) Molecular interactions between calmodulin and berberine analogs. The structures of calmodulin, berberine, and palmatine are colored in gray, yellow, and orange, respectively. (a) The methylenedioxybenzene moiety of berberine is buried in the pocket of calmodulin. (b) The dimethoxybenzene moiety of palmatine interacts with the same pocket as that of berberine. The isoquinoline moiety of palmatine is flipped relative to that of berberine in their bound forms. (c,d) Molecular interactions between RXRα-LBD and berberine analogs. The structures of RXRα-LBD, berberine, and palmatine are colored in gray, yellow, and orange, respectively. (c) Berberine binds to a pocket of RXRα in the vicinity of the other binding pocket for the genuine RXRα ligand. (d) Palmatine attaches to the same pocket that berberine does. The binding pose of palmatine is different from that of berberine.