Figures & data
Figure 1. The over-expression of TNNT1 in colon adenocarcinoma caused poor prognosis. (a) TNNT1 was up-regulated in colon adenocarcinoma tissues compared with human normal tissues. (b) The overall survival curve of patients with colon adenocarcinoma. (c) TNNT1 expression level in different cell lines through qRT-PCR method. The experiments were performed in three times and *P < 0.05, ***P < 0.001.
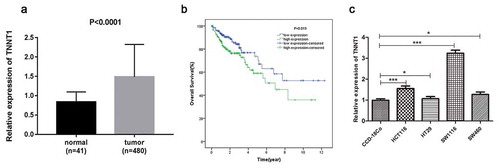
Figure 2. Knockdown of TNNT1 inhibited proliferation, migration and invasion of SW1116 cells.
(a) The expression of TNNT1 was dramatically decreased after si-TNNT1#1/si-TNNT1#2 transfection using qRT-PCR analysis. (b) The protein expression of TNNT1 was impaired by si-TNNT1#1/si-TNNT1#2 compared with si-con group and (c) quantified. (d) The proliferative ability was examined by CCK-8 assay. (e) and (f) Cell migration and invasion were exhibited and the cell numbers were quantified. *P < 0.05 and **P < 0.01.
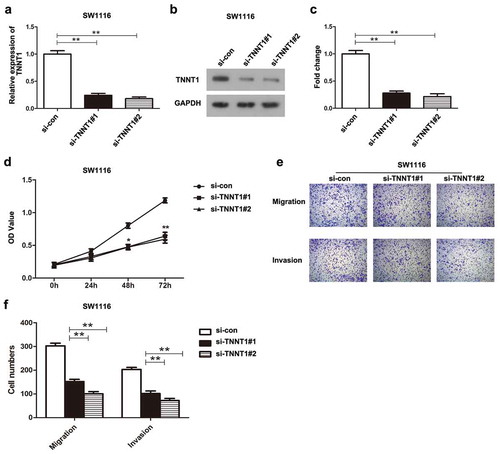
Figure 3. Overexpression of TNNT1 promoted the proliferative, migratory and invasive abilities of HT29 cells. (a) The expression of TNNT1 was significantly increased after pcDNA3.1-TNNT1 transfection by qRT-PCR analysis. (b) The protein expression of TNNT1 was up-regulated compared with control and pcDNA3.1 empty vector groups and (c) quantified. (d) The proliferative ability was detected by CCK-8 assay. (e) and (f) Cell migration and invasion were shown utilizing transwell assays and the cell numbers were quantified. **P < 0.01.
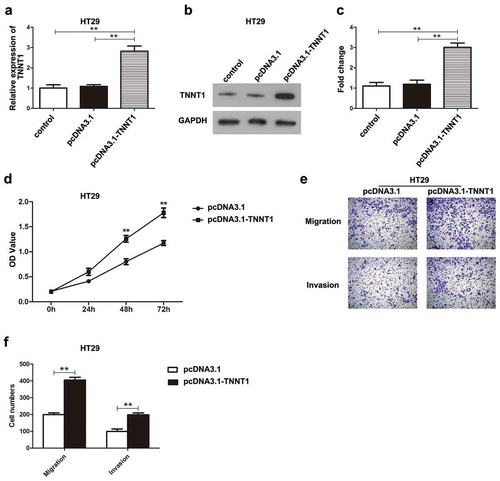
Figure 4. TNNT1 affected the expressions of epithelial–mesenchymal transition (EMT)-related proteins in colon adenocarcinoma cells (a) Si-TNNT1#2 was an inducer for E-cadherin and inhibitor for N-cadherin, Vimentin, Snail and MMP9 in SW1116 cells via western blot. (b) The gray value of protein bands was quantified. (c) Overexpression of TNNT1 inhibited E-cadherin whilst increased N-cadherin, Vimentin, Snail and MMP9. (d) The gray value of protein bands was analyzed. **P < 0.01.