354
Views
2
CrossRef citations to date
0
Altmetric
Biochemistry & Molecular Biology

Oxidation of isomaltose, gentiobiose, and melibiose by membrane-bound quinoprotein glucose dehydrogenase from acetic acid bacteria

, , &
Pages 507-517 | Received 29 Aug 2019, Accepted 29 Oct 2019, Published online: 13 Nov 2019

Figures & data

Table 1. Substrate specificities of the membran fraction for disaccharides [Citation4,Citation5].

Figure 1. Oxidation of lactose and isomaltose by resting cells of A. orientalis KYG22.

The resting cells of KYG22 (2.7 U/mL) were incubated with 1% lactose or isomaltose in 1.4 mg/mL CaCO3 at 27°C with shaking for the indicated times (h). The reaction mixtures were analyzed using TLC. The spots of lactobionic acid and isomaltose oxide migrated slower than those of lactose and isomaltose, respectively. The pH of the cultures was 5.1–5.7.
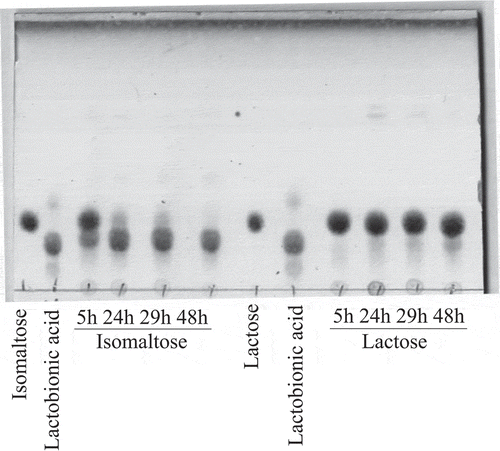
Figure 1. Oxidation of lactose and isomaltose by resting cells of A. orientalis KYG22.The resting cells of KYG22 (2.7 U/mL) were incubated with 1% lactose or isomaltose in 1.4 mg/mL CaCO3 at 27°C with shaking for the indicated times (h). The reaction mixtures were analyzed using TLC. The spots of lactobionic acid and isomaltose oxide migrated slower than those of lactose and isomaltose, respectively. The pH of the cultures was 5.1–5.7.

Figure 2. Isomaltose and lactose oxidation by resting cells of various AAB.

AAB were cultivated in YPGL medium for 3 days. After the cultivation pH and A660 of the media were measured, the resting AAB were incubated with 1% isomaltose or lactose in 100 mM acetate buffer (pH 5.5) for 24 h with shaking. After boiling the reaction mixture for 5 min, the production of isomaltobionic acid (white bars) and lactobionic acid (black bars) was measured by HPAEC-PAD. The amounts of isomaltobionic acid are shown as the equivalent amounts of lactobionic acid. The experiments were performed 3–5 times and means ± standard deviations are plotted.
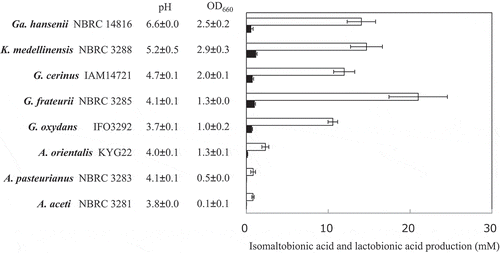
Figure 2. Isomaltose and lactose oxidation by resting cells of various AAB.AAB were cultivated in YPGL medium for 3 days. After the cultivation pH and A660 of the media were measured, the resting AAB were incubated with 1% isomaltose or lactose in 100 mM acetate buffer (pH 5.5) for 24 h with shaking. After boiling the reaction mixture for 5 min, the production of isomaltobionic acid (white bars) and lactobionic acid (black bars) was measured by HPAEC-PAD. The amounts of isomaltobionic acid are shown as the equivalent amounts of lactobionic acid. The experiments were performed 3–5 times and means ± standard deviations are plotted.
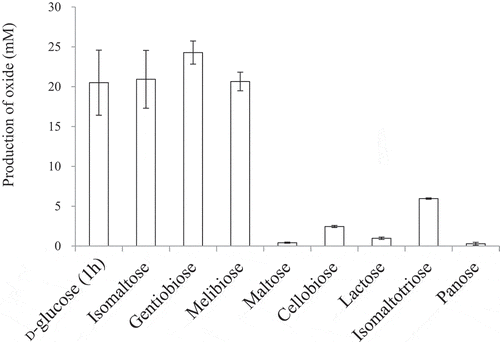
Table 2. Substrate specificities of the resting cells of AABs on oligosaccharides.

Figure 3. Production of various aldonic acids by the resting cells of NBRC 3285.

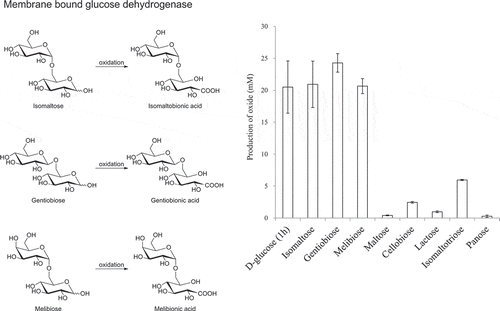
The resting cells of NBRC 3285 were incubated with 27.8 mM substrate in 100 mM acetate buffer (pH 5.5) at 27°C for 1 h (D-glucose) or 24 h (other saccharides) with shaking. The production of each saccharide oxide was measured by HPAEC-PAD. Oxidized products of D-glucose were measured using D-gluconic acid as a standard. The amounts of other oxides were measured as the equivalent amounts of lactobionic acid. The experiments were performed 3–5 times and means ± standard deviations are plotted.

Figure 3. Production of various aldonic acids by the resting cells of NBRC 3285.The resting cells of NBRC 3285 were incubated with 27.8 mM substrate in 100 mM acetate buffer (pH 5.5) at 27°C for 1 h (D-glucose) or 24 h (other saccharides) with shaking. The production of each saccharide oxide was measured by HPAEC-PAD. Oxidized products of D-glucose were measured using D-gluconic acid as a standard. The amounts of other oxides were measured as the equivalent amounts of lactobionic acid. The experiments were performed 3–5 times and means ± standard deviations are plotted.

Table 3. Production of aldonic acids by the resting cells of AAB.

Table 4. Assiment of isomaltobionic acid and melibionic acid.

Figure 4. Effects of D-glucose addition on isomaltose oxidation.

Inhibition of isomaltose oxidation by D-glucose was investigated. The resting cells of NBRC 3285 were incubated with 27.6 mM (triangles) or 55.2 mM (squares) isomaltose and 0–111 mM D-glucose. After incubation for 1 h, isomaltobionic acid production was measured using HPAEC-PAD (left ordinate, white symbols, means ± standard deviations). The pH values of the reaction mixtures (right ordinate, black symbols, means) were also measured in two independent experiments.
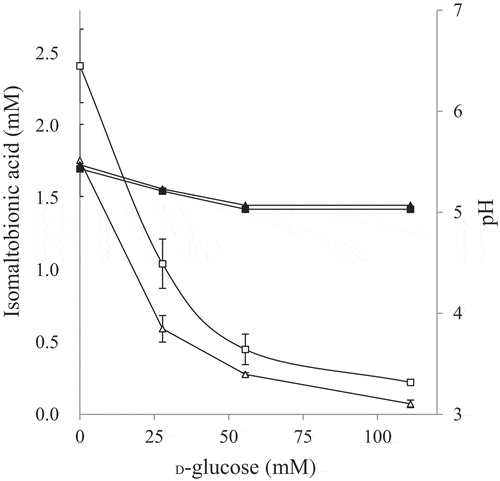
Figure 4. Effects of D-glucose addition on isomaltose oxidation.Inhibition of isomaltose oxidation by D-glucose was investigated. The resting cells of NBRC 3285 were incubated with 27.6 mM (triangles) or 55.2 mM (squares) isomaltose and 0–111 mM D-glucose. After incubation for 1 h, isomaltobionic acid production was measured using HPAEC-PAD (left ordinate, white symbols, means ± standard deviations). The pH values of the reaction mixtures (right ordinate, black symbols, means) were also measured in two independent experiments.

Figure 5. Oxidation of disaccharides by m-GDH-deficient NBRC 3288 mutant.

Resting cells of NBRC 3288 wild-type (Wild) and m-GDH-deficient mutant (ΔGDH) were prepared, and sugar-oxidizing activities were measured using HPAEC-PAD. The reaction times of D-glucose, lactose, and the other oligosaccharides were 1 h, 24 h, and 7 h, respectively. The graph shows the production of oligoaldonic acids by the wild-type strain (gray bars) and mutant strain (white bars, too low to see). The experiments were performed 3–5 times and means ± standard deviations are plotted.
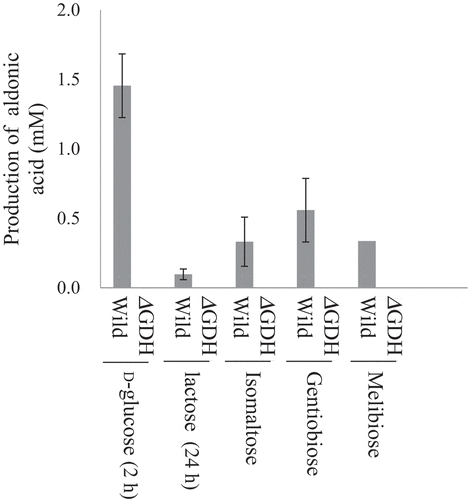
Figure 5. Oxidation of disaccharides by m-GDH-deficient NBRC 3288 mutant.Resting cells of NBRC 3288 wild-type (Wild) and m-GDH-deficient mutant (ΔGDH) were prepared, and sugar-oxidizing activities were measured using HPAEC-PAD. The reaction times of D-glucose, lactose, and the other oligosaccharides were 1 h, 24 h, and 7 h, respectively. The graph shows the production of oligoaldonic acids by the wild-type strain (gray bars) and mutant strain (white bars, too low to see). The experiments were performed 3–5 times and means ± standard deviations are plotted.

Figure 6. Assimilation of isomaltose and isomaltooligosaccharide by NBRC 3285 and NBRC 3288.

NBRC 3285 (a) and NBRC 3288 (b) were cultivated with isomaltose, lactose, lactobionic acid, isomaltooligosaccharide, D-glucose, or isomaltobionic acid. The growth of both of AAB (A660, white bars) and the production of acid (pH, gray circles) were measured to evaluate the assimilation of the sugars. The growth of NBRC 3288 in isomaltobionic acid was not determined. The experiments were performed 3–5 times (means ± standard deviations are plotted). Only the pH measurements for NBRC 3288 were carried out twice (means are plotted). The indicated statistical comparisons were performed using Student’s t tests.
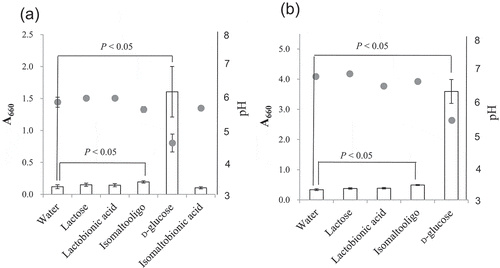
Figure 6. Assimilation of isomaltose and isomaltooligosaccharide by NBRC 3285 and NBRC 3288.NBRC 3285 (a) and NBRC 3288 (b) were cultivated with isomaltose, lactose, lactobionic acid, isomaltooligosaccharide, D-glucose, or isomaltobionic acid. The growth of both of AAB (A660, white bars) and the production of acid (pH, gray circles) were measured to evaluate the assimilation of the sugars. The growth of NBRC 3288 in isomaltobionic acid was not determined. The experiments were performed 3–5 times (means ± standard deviations are plotted). Only the pH measurements for NBRC 3288 were carried out twice (means are plotted). The indicated statistical comparisons were performed using Student’s t tests.
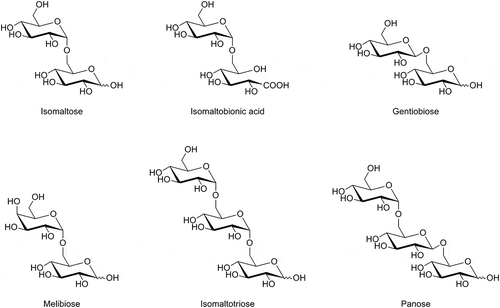
Figure 7. Structural formulae of the oligosaccharides.

Figure 7. Structural formulae of the oligosaccharides.
Supplemental material

supplment_data__final.pptx

Download MS Power Point (298.8 KB)

Reprints and Corporate Permissions

Please note: Selecting permissions does not provide access to the full text of the article, please see our help page How do I view content?

To request a reprint or corporate permissions for this article, please click on the relevant link below:

Academic Permissions

Please note: Selecting permissions does not provide access to the full text of the article, please see our help page How do I view content?

Obtain permissions instantly via Rightslink by clicking on the button below:

If you are unable to obtain permissions via Rightslink, please complete and submit this Permissions form. For more information, please visit our Permissions help page.