
Figures & data
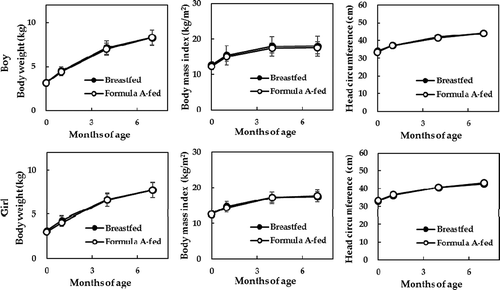
Table 1. Nutritional composition of renewed commercial infant formula.
Table 2. Baseline characteristics of Formula A-fed and breastfed infants.
Figure 1. Flowchart of the analysis design.
BMI, body mass index; HC, head circumference
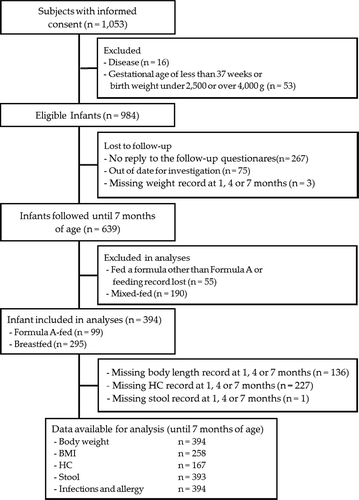
Figure 2. (a) Body weight, (b) body mass index, (c) head circumference, and (d) stool consistency up to 7 months of age. Two-way ANOVA with repeated measures showed a significant time-dependent effect (P < .05), but no group-dependent effects or group-by-time interaction effects in any of the growth measurements. Stool consistency was rated on 3 grades (watery, soft, and formed to hard). No differences between groups were observed at 1, 4, and 7 months of age (using a chi-squared test).
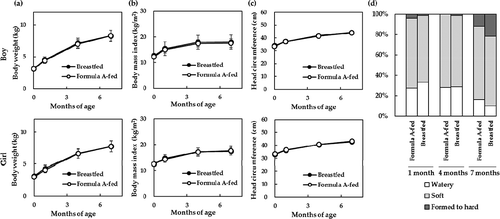
Figure 3. A follow-up of body weight, body mass index, and head circumference at 12 months of age. The numbers of Formula A-fed and breastfed infants are as follows: body weight in boys (n = 40 and n = 121) and in girls (n = 34 and n = 114), BMI in boys (n = 28 and n = 81) and in girls (n = 22 and n = 76), and health status in boys (n = 21 and n = 58) and in girls (n = 15 and n = 51), respectively. No differences were observed in any growth measurements at the 12-month follow-up based on a Student’s t-test.
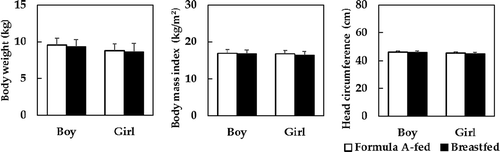
Table 3. The number of infants who experienced fever, infections and allergies.