Figures & data
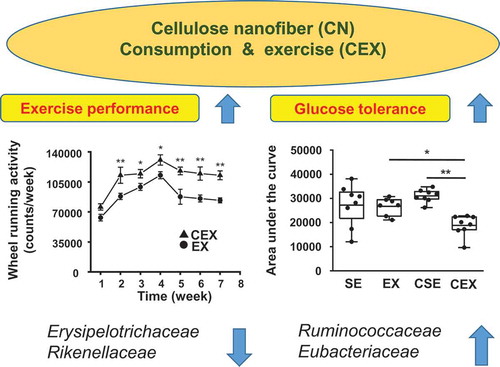
Figure 1. Effects of cellulose nanofiber (CN) intake and exercise on wheel running activity and body weight in high-fat diet-fed mice.
(a) Wheel running activity in exercised mice. (b) Body weight change over 7 weeks. SE, CN-untreated sedentary group; EX, CN-untreated exercise group; CSE, CN-treated sedentary group; CEX, CN-treated exercise group. The data are presented as the means ± SEM; *P < 0.05; **P < 0.01.
Figure 2. Effects of cellulose nanofiber (CN) intake and exercise on body weight gain and fat accumulation in high-fat diet-fed mice.
(a) Increase in body weight after 7 weeks. Changes in (b) epididymal fat mass, (c) visceral fat mass, and (d) subcutaneous fat mass. SE, CN-untreated sedentary group; EX, CN-untreated exercise group; CSE, CN-treated sedentary group; CEX, CN-treated exercise group. *P < 0.05; ***P < 0.001.
Figure 3. Effects of cellulose nanofiber (CN) intake and exercise on glucose tolerant test (GTT) results in high-fat diet-fed mice.
(a) GTTs at week 7. (b) Area under the curves of blood glucose. SE, CN-untreated sedentary group; EX, CN-untreated exercise group; CSE, CN-treated sedentary group; CEX, CN-treated exercise group. *P < 0.05; **P < 0.01.
Figure 4. Effects of cellulose nanofiber (CN) intake and exercise on the gut microbiota composition in high-fat diet-fed mice at the family level.
(a) Principal component analysis (PCA). (b) Taxonomic distribution of gut microbiota. SE, CN-untreated sedentary group; EX, CN-untreated exercise group; CSE, CN-treated sedentary group; CEX, CN-treated exercise group.
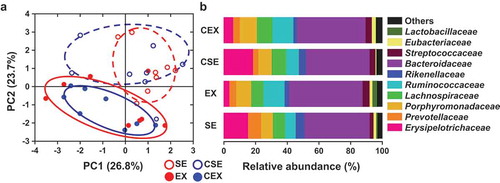
Figure 5. Effects of cellulose nanofiber (CN) intake and exercise on the gut microbiota composition in high-fat diet-fed mice.
Results for (a) Erysipelotrichaceae, (b) Ruminococcaceae, (c) Rikenellaceae, and (d) Eubacteriaceae. SE, CN-untreated sedentary group; EX, CN-untreated exercise group; CSE, CN-treated sedentary group; CEX, CN-treated exercise group. *P < 0.05; ***P < 0.001.
Figure 6. Effects of cellulose nanofiber (CN) intake and exercise on short-chain fatty acid (SCFA) levels in cecum.
Levels of (a) acetate, (b) propionate, (c) butyrate, and (d) valerate.