
Figures & data
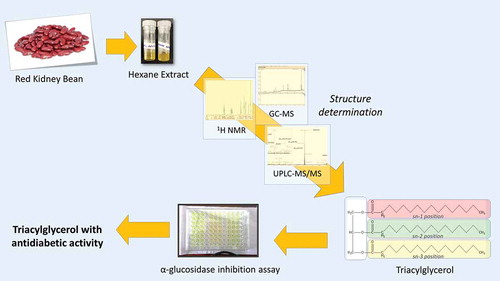
Table 1. Fatty acid composition and unsaturation ratio in each fraction from GC/MS analysis.
Table 2. Mass number of parent peak and fragment peaks (diacylglycerol and acylium ion) of triacylglycerols (TAGs).
Table 3. Neutral loss and fatty acid loss determined for each diacylglycerol detected.
Figure 1. Fragmentation scheme of triacylglycerol.
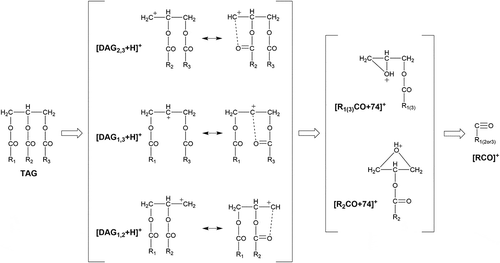
Figure 2. Positive ion mass spectra of fractions A and B. Fraction A contained TAG 1 with spectrum of MS (a) and MS-MS of m/z 873 (b), and fraction B contained TAG 2 with spectrum of MS (c) and MS-MS of m/z 875 (d).
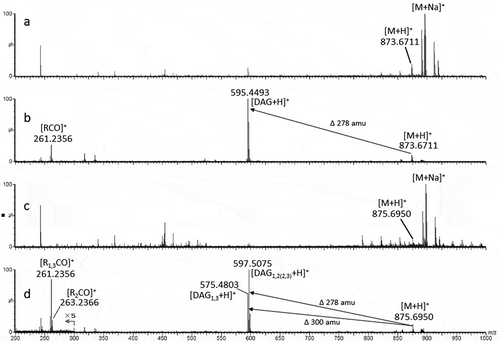
Table 4. Summary of TAG molecular species in the triacylglycerol fraction and IC50 of α-glucosidase inhibition activity.
Supplemental material