
Figures & data
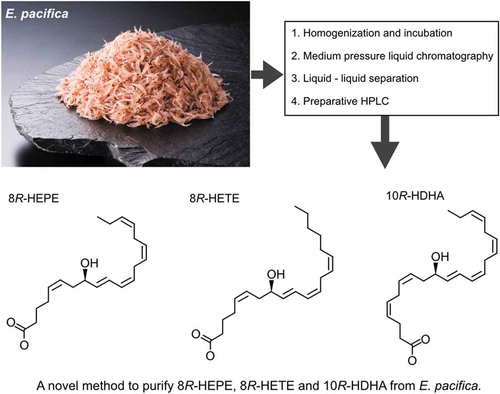
Figure 1. Structure and m/z of 8-HEPE, 8-HETE, and 10-HDHA.
Table 1. Proportion of lipid class in incubated E. pacifica oil.
Table 2. LC/QTOF analysis of PC and fatty acid in incubated E. pacifica oil.
Figure 2. Examination of the conditions of incubation to increase the levels of 8-HEPE, 8-HETE, and 10-HDHA.
Examination of incubation temperature, pH (a) and buffer volume (b). The value corresponding to E. pacifica extract prior to incubation was used as a control. B. The ratio shown in the x-axis refers to the weight of E. pacifica: water volume. A,B. Samples were incubated for 3 h. (c) Examination of incubation time. (a-c) Values are the mean ± s.d. of four samples. * indicate a significant difference compared with the control (p < 0.05). Values marked by different letters were significantly different (p < 0.05).
Table 3. Examination of the concentration of 8-HETE, 8-HEPE, and 10-HDHA using synthetic adsorbent beads. Values are the mean of three examinations.
Figure 3. Examination of liquid-liquid separation.
The contents of 8-HEPE, EPA and PA in the upper or lower fraction were quantified by LC/QTOFMS. Values are the mean of three examinations.
Table 4. Summary of the purification of 8-HEPE, 8-HETE, and 10-HDHA from 1 kg of E. pacifica.
Figure 4. Scheme outlining the purification of 8-HEPE, 8-HETE, and 10-HDHA from 1 kg of E. pacifica.
Values are the mean of six examinations. Chromatograms of preparative HPLC are shown at the bottom. The peaks of 8-HEPE, 8-HETE and 10-HDHA are annotated in the 235 nm chromatogram. The chromatogram shows the peak corresponding to 8-HEPE. An expanded range around the peaks for 10-HDHA and 8-HETE is shown in supplemental Figure S2.
Figure 5. Stereochemical analysis of 8-HETE, 8-HEPE, and 10-HDHA purified from E. pacifica.
The chromatograph of 8-HETE was an extracted ion chromatogram of product ion (m/z = 155.071) generated from precursor ion (m/z = 319.2). The chromatograph of 8-HEPE was an extracted ion chromatogram of product ion (m/z = 155.071) generated from precursor ion (m/z = 317.2). The chromatograph of 10-HDHA was an extracted ion chromatogram of product ion (m/z = 153.092) generated from precursor ion (m/z = 343.2).
08_Supplemental_data_YamadaH_BBB_P1.docx
Download MS Word (493.6 KB)Data availability statement
The data that support the findings of this study are available from the corresponding author, H.Y., upon reasonable request.