Figures & data
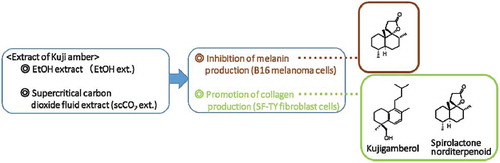
Figure 1. HPLC profiles of the extracts of Kuji amber and structures of each peak.
(a) HPLC profile of the EtOH ext. of Kuji amber, (b) HPLC profile of the scCO2 ext. of Kuji amber.Injection: 50 μg, Flow rate: 1.0 ml/min, Solvent: 85% MeOH, Detector: 205 nm, Pump: PU-2080 (Nihon Bunko Co. Ltd.), Detector: PDA (MD-2018), Column: CAPCELL PAK C18(ODS 4.6 mmφ ×150 mm, TYPE UG 120 Å, 5 μm). (c) Structures of each peak.
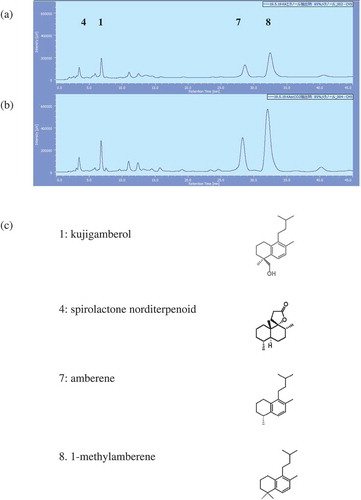
Figure 2. Effects of the EtOH ext. and the scCO2 ext. of Kuji amber against B16 mouse melanoma cells.
(a) Cytotoxicity of the EtOH ext. and the scCO2 ext. of Kuji amber against B16 mouse melanoma cells. (b) Microscopic observation of melanin production in B16 mouse melanoma cells treated by the EtOH ext. and the scCO2 ext. of Kuji amber. a) Without IBMX stimulation, b) with 100 µM IBMX, c) with 100 µM IBMX+ the EtOH ext. of Kuji amber (1 µg/mL), d) with 100 µM IBMX+ the EtOH ext. of Kuji amber (10 µg/mL), e) with 100 µM IBMX+ the scCO2 ext. of Kuji amber (1 µg/mL), f) with 100 µM IBMX+ scCO2 ext. of Kuji amber (10 µg/mL). Scale bar = 50 µm. (c) Quantification of melanin production in B16 mouse melanoma cells by the EtOH ext. and the scCO2 ext. of Kuji amber. * p < 0.05 (significant difference compared to the control). (d) Microscopic observation of melanin production in B16 mouse melanoma cells by the scCO2 ext. of Kuji amber and β- arbutin. a) Without IBMX stimulation, b) with 100 µM IBMX, c) with 100 µM IBMX+ the scCO2 ext. of Kuji amber (10 µg/mL), d) with 100 µM IBMX+ β-arbutin (25 µM). Scale bar = 50 µm. (e) Quantification of melanin production in B16 mouse melanoma cells by the scCO2 ext. of Kuji amber and β-arbutin. * p < 0.05 (significant difference compared to the control).
Figure 3. Tyrosinase inhibition activities of the EtOH ext. and the scCO2 ext. of Kuji amber. ■ EtOH extract, ![]()
Figure 4. Effect of the EtOH ext. and the scCO2 ext. of Kuji amber against human normal fibroblast SF-TY cells.
(a) Cytotoxicity of the EtOH ext. and the scCO2 ext. of Kuji amber against human fibroblast SF-TY cells. (b) Effect on collagen production in SF-TY cells by the EtOH ext. and the scCO2 ext. of Kuji amber. (c) Quantification of the collagen production in SF-TY cells by the scCO2 ext. and L-ascorbic acid(n = 5). *p < 0.05 (significant difference compared to the control).
Figure 5. Inhibition of melanin production in B16 melanoma cells and the promotion of collagen production in SF-TY cells by kujigamberol.
(a) Cytotoxicity of kujigamberol against B16 melanoma cells. (b) Cytotoxicity of kujigamberol against SF-TY fibloblast cells. (c) Inhibition of melanin production in B16 melanoma cells by kujigamberol. (d) Promotion of collagen production in SF-TY fibroblast cells by kujigamberol..
Figure 6. Inhibition of melanin production in B16 melanoma cells and the promotion of collagen production in SF-TY cells by spirolactone norditerpenoid.
(a) Cytotoxicity of spirolactone norditerpenoid against B16 melanoma cells. (b) Cytotoxicity of spirolactone norditerpenoid against SF-TY fibloblast cells. (c) Inhibition of melanin production in B16 melanoma cells by spirolactone norditerpenoid. *p < 0.05, **p < 0.01 (significant difference compared to the control). (d) Promotion of collagen production in SF-TY fibroblast cells by spirolactone norditerpenoid. *p < 0.05, **p < 0.01 (significant difference compared to the control).