Figures & data
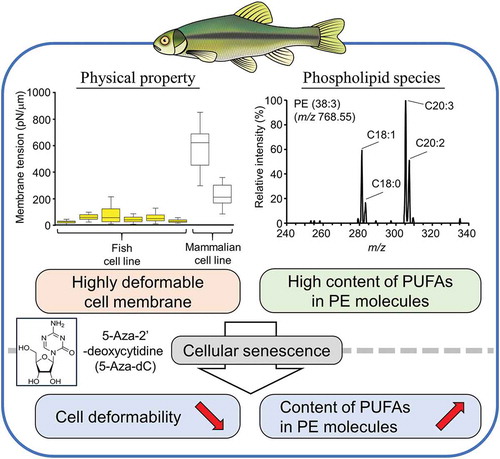
Figure 1. Lipid composition of the fish cell membrane.
Phospholipid composition (a) and cholesterol contents (b) of EPC, BRF-41, GEM-81, OMF, EK1, and HINAE cells. Values are expressed as Means ± SDs.
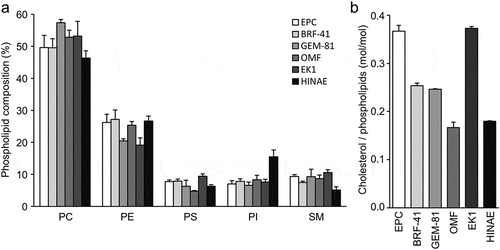
Figure 2. Membrane deformability of fish cell lines.
(a) Schematic of the micropipette aspiration assay. Lp, Rp, and Rc indicate protrusion length, inner radius of the pipette, and cell radius, respectively. (b) EPC cells were aspirated using cylindrical micropipettes at 60 Pa hydrostatic pressure. Scale bar = 10 μm. (c) Representative data from the micropipette aspiration assay for the EPC cell line. Membrane tensions (d) and Young’s moduli (e) for EPC, BRF-41, GEM-81, OMF, EK1, HINAE, HeLa, and PC3 cells were calculated from the linear function using the law of Laplace and the theoretical model. Values are expressed as Means ± SDs, and the number of analyzed cells are shown in parentheses. *** P < 0.001 by Tukey’s test.
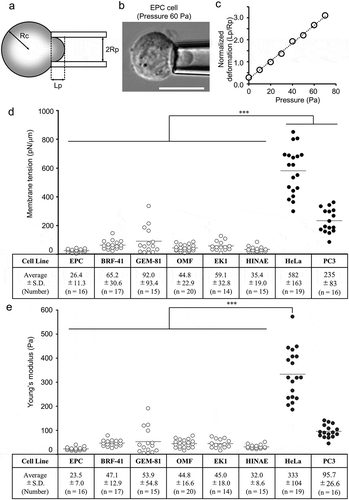
Figure 3. Cellular senescence induced by 5-Aza-dC.
(a) DNA methylation levels in EPC cells treated with 10 μM 5-Aza-dC or vehicle were measured using the MethylampTM Global DNA Methylation Quantification Kit (n = 3). Values are expressed as Means ± SDs. ** P < 0.01 by Student’s t-test. (b) EPC cells were stained with X-gal to detect the activity of SA-β-gal. Scale bar = 100 μm. (c) Cell nuclei were stained with Hoechst 33342 dye. Arrows indicate lobulated nuclei and enlarged nuclei, and arrowheads indicate fragmented nuclei. Scale bar = 50 μm. (b, c) Representative results from three independent experiments are shown. Membrane tensions (d) and Young’s moduli (e) for EPC cells treated with vehicle, 10 μM 5-Aza-dC, and 40 μM H2O2. Values are expressed as Means ± SDs, and the number of analyzed cells are shown in parentheses. n.s. = not significant, *** P < 0.001 by Tukey’s test.
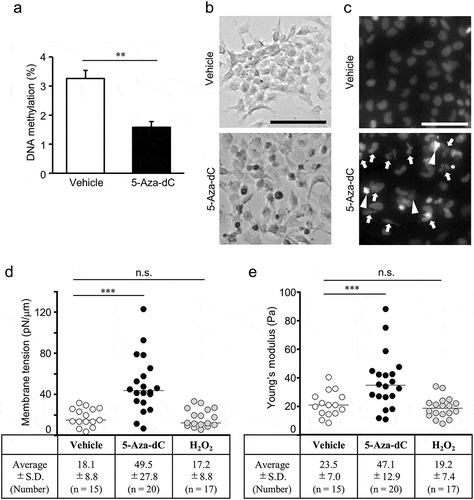
Figure 4. Changes in phospholipid molecules after 5-Aza-dC treatment.
PC (a) and PE (b) molecules in EPC cells treated with vehicle or 10 μM 5-Aza-dC were analyzed by LC-MS/MS. Phospholipid molecules were presented in the format PC (X:Y) or PE (X:Y), where X denotes the total number of acyl chain carbons and Y denotes the total number of double bonds in acyl chains (n = 3). Values are expressed as Means ± SDs. *P < 0.05, **P < 0.01, by Student’s t-test.
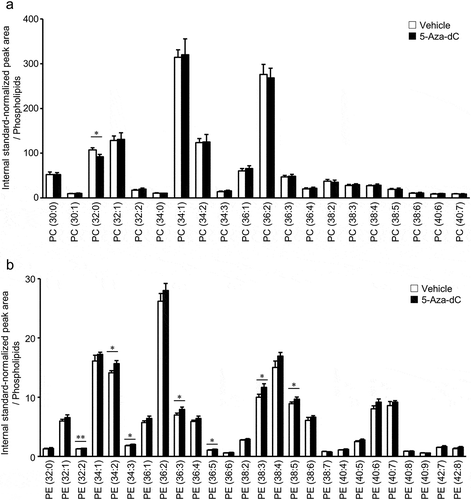
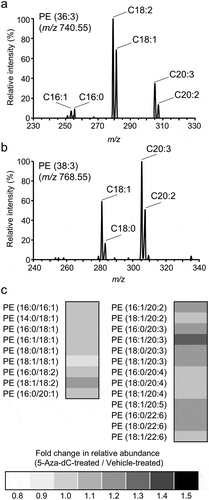
Figure 5. Changes in molecular species of PE after 5-Aza-dC treatment.
Components of fatty acids in PE (36:3) (a) and PE (38:3) (b) were analyzed using product ion scan analysis with LC-MS/MS. (c) The fold changes of relative peak areas were described using a heat map. PE molecules were presented in the format PE (X/Y), where X and Y denote fatty acid species. The order of fatty acids does not represent the position of acyl chains in the PE molecule.