Figures & data
Figure 1. The gene expression patterns of PEPC isogenes in RNA-Seq data of soybean seeds. (a) Heat map showing the gene expression patterns in whole seeds at different growth stages. (b) Heat map of the gene expression levels in cotyledons at different growth stages. (c) Score plot of the results of the PCA based on the expression patterns of Gmppc genes in the heatmap. White circles: Plant-type isogenes. Black circles: Bacterial-type isogenes. 1: Glyma.01G091000, 2: Glyma.02G130700, 3: Glyma.06G229900, 4: Glyma.06G277500, 5: Glyma.10G205500, 6: Glyma.12G161300, 7: Glyma.12G210600, 8: Glyma.12G229400, 9: Glyma.13G270400, 10: Glyma.13G290700. (d) Variance of the principal components in the PCA based on the expression patterns of Gmppc genes in the heatmap.
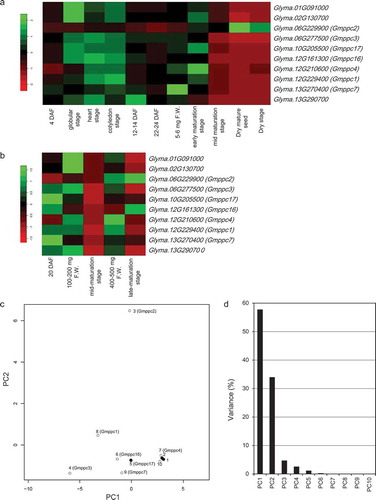
Figure 2. The results of the gene expression analysis in developing seeds by quantitative RT-PCR. (a) The gene expression pattern of Gmppc2 in whole seeds. Horizontal axis: The relative expression level of Gmppc2. Vertical axis: The sample stage. Error bar: Standard Standard error (SE). (b) The gene expression of Gmppc2 in separated seed tissues. Error bar: SE.
Figure 3. The expression of PEPC in developing soybean seeds. (a) Partial sequence alignment of the ten PEPC isoforms of the C-termini. Bold letters: The region that was used to raise a Gmppc2-specific polyclonal antibody. (b) Dot blot assay to determine the specificity of the Gmppc2 antibody. (c) The protein expression patterns of Gmppc2, plant-type PEPC, and bacterial-type PEPC in developing whole seeds during seed maturation from DS1 to DS7. (d) The effect of nitrogen application on the expression of Gmppc2 protein. The measurement was duplicated, and the average of the values is shown. Error bar: Standard error (SE). Significance at *10% and **5% by Student’s t-test. e: The effect of nitrogen application on PEPC activity. Error bar: SE.