Figures & data
Figure 1. Transepithelial electrical resistance (TER) in a Caco-2 cell monolayer, and heatmap of the differentially expressed genes as identified by microarray data.
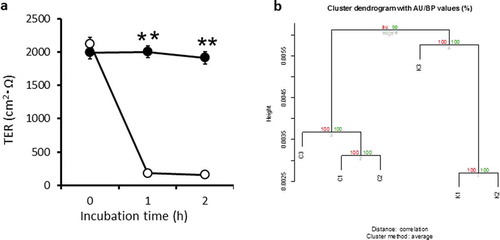
Table 1. GO terms in the deepest level of hierarchy and genes significantly up/down regulated by K. septempunctata infection (FDR<0.05, Benjamini<0.05). Gene title list addressed in S1 Table.
Table 2. A list of biological process Gene Ontology (GO) terms of “cell adhesion” and “tight junction” and their component genes by K. septempunctata infection (FDR<0.05, Benjamini<0.05).
Table 3. The enriched KEGG pathway of K. septempunctata infection.
Figure 2. Heat map of inflammation-related genes.
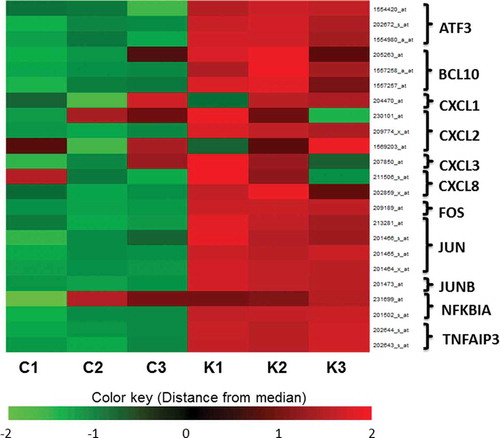
Figure 3. Mapping of the extracted gene products in pathways stimulated by K. septempunctata invasion.
Figure 4. Effect of incubation with K. septempunctata on IL-8 and 5-HT production by Caco-2 cell monolayers.