Figures & data
Figure 1. Identification of aldA promoter region.
Each transformant having each reporter plasmid was grown on BM and LB plates containing kanamycin (20 μg/mL) at 30°C for 6 and 2 days, respectively. The cells were collected by scraping from the plates, washed with 0.85% KCl, and suspended with the lux buffer (50 mN Na-phosphate, pH 7.0; 50 mM 2-mercaptoethanol; 2% bovine serum albumin) at an A600 of 10. Forty microliters of 0.1% (v/v) 1-decanal were added to 160 μL of the cell suspension and luminescence was measured immediately at 490 nm using a luminometer. Closed and open squares represent luminescence intensity of the cells grown on BM and LB, respectively. Error bars show standard deviations from biological triplicates. Statistical significance was calculated by the two-tailed t-test and one-way ANOVA. *p < 0.001; *p < 0.05; ns, not significant.
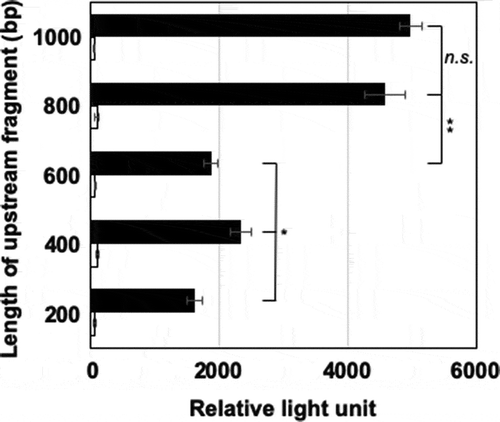
Figure 2. Gene organization between aldA and mnoA in R. erythropolis N9T-4.
The gene annotations (accession no. LC514289) for open reading frames in the figure are as follows: aldA, NAD-dependent aliphatic dehydrogenase; aldR1 and aldR2, transcriptional regulators examined in this study; mnoA, N,N’-dimethyl-4-nitrosoaniline-dependent methanol dehydrogenase; A, GMC family oxidoreductase; B, glycosyltransferase; C, peptidyl dipeptidase; D, HNH endonuclease; E, FadH/OYE family oxidoreductase; F, NAD-dependent oxidoreductase; G, FadH/OYE family oxidoreductase; H, heme/Flavin dehydrogenase; I, radical SAM maturase; J, mycofactocin binding protein; K, mycofactocin precursor; L, SAM methyltransferase; M, ABC permease; N, ABC ATP-binding protein; O, transcriptional regulator; P, response regulator; Q, sensor histidine kinase; R, Fe-alcohol dehydrogenase; S, ATPase. The gene products of the other open reading frames are annotated as hypothetical proteins.
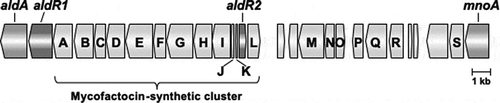
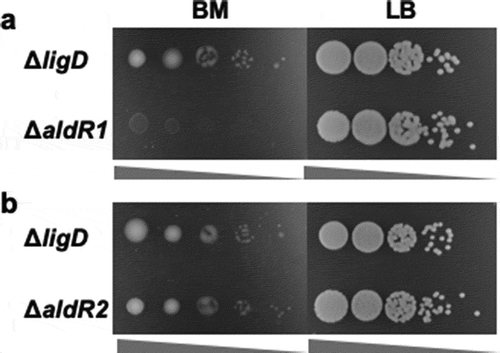
Figure 3. Oligotrophic and heterotrophic growth of ΔaldR1 (a) and ΔaldR2 (b).
Ten microliters of cell suspensions with the OD600 = 10−2-10−6 were spotted on BM and LB plates and cultivated at 30°C for 4 and 2 days, respectively. ΔligD was used as a control strain. The concentration of the spotting cell suspension was low from left to right in each photograph.