
Figures & data
Figure 1. Expression and purification of recombinant trehalose-6-phosphate synthase (TPS).
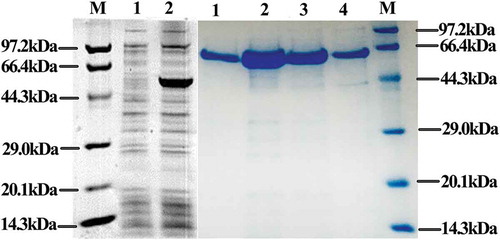
Figure 2. Enzymatic properties of recombinant trehalose-6-phosphate synthase (TPS).
Figure 3. Kinetics analysis of recombinant trehalose-6-phosphate synthase (TPS) reaction rates.
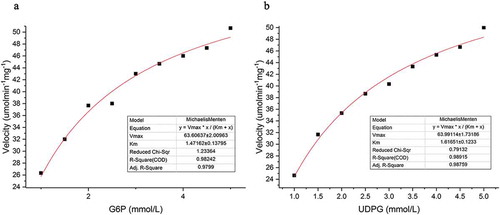
Figure 4. Structure analysis of TPS, 1GZ5 and 5K5C.
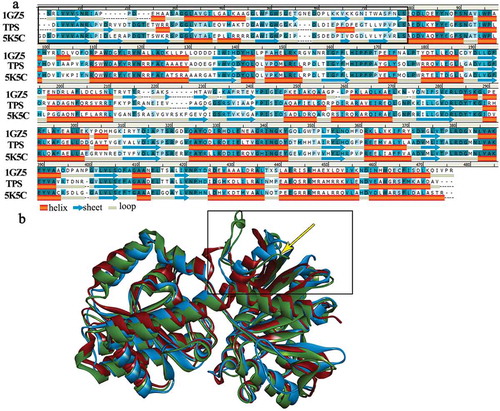
Figure 5. Maximum-Likelihood tree showing the phylogenetic positions of strain YLB-01T and other OTSA protein sequences.
Figure 6. Multiple amino acid sequence alignment of TPS and other OTSA.
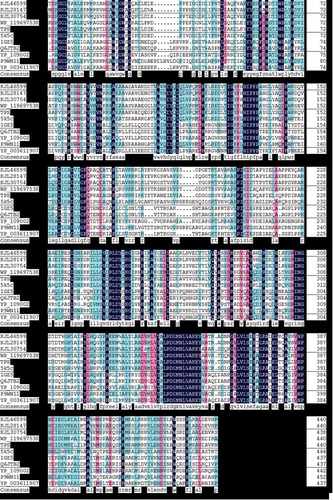
Table 1. Comparison of the enzymatic properties of trehalose-6-phosphate synthases expressed by various bacteria.
Table 2. Comparison of the kinetics of trehalose-6-phosphate synthases expressed by various bacteria.
Supplemental material