412
Views
3
CrossRef citations to date
0
Altmetric
Organic Chemistry

Metabolomic analyses of plasma and liver of mice fed with immature Citrus tumida peel

, , , , &
Pages 1098-1104 | Received 10 Sep 2019, Accepted 26 Dec 2019, Published online: 04 Feb 2020

Figures & data

Table 1. Flavonoid content in peels of immature Citrus tumida (100 mg).

Figure 1. Effects of supplementation of the peels of immature Citrus tumida (PIC) on (a) cumulative body weight gain, (b) food intake, (c) water intake, and (d) feed efficiency (n = 6–7 in each group).

Control: mice fed with AIN93G diet; PIC: mice fed with AIN93G supplemented with 5% PIC (w/w) diet. Data are expressed as mean ± SEM. P < 0.10, *P < 0.05, **P < 0.01 versus control.

Figure 1. Effects of supplementation of the peels of immature Citrus tumida (PIC) on (a) cumulative body weight gain, (b) food intake, (c) water intake, and (d) feed efficiency (n = 6–7 in each group).Control: mice fed with AIN93G diet; PIC: mice fed with AIN93G supplemented with 5% PIC (w/w) diet. Data are expressed as mean ± SEM. †P < 0.10, *P < 0.05, **P < 0.01 versus control.
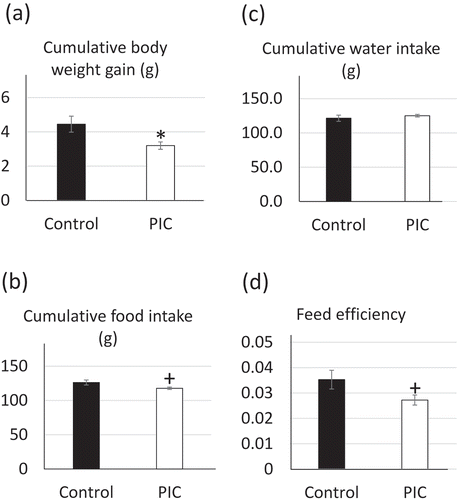
Figure 2. Effects of supplementation of the peels of immature Citrus tumida (PIC) on (a) cumulative liver weight, (b) epididymal fat weight, (c) perirenal fat weight, and (d) subcutaneous fat weight (n = 6–7 in each group).

Control: mice with fed AIN93G diet; PIC: mice fed with AIN93G containing 5% PIC (w/w) diet. Data are expressed as mean ± SEM. *P < 0.05, **P < 0.01 versus control.
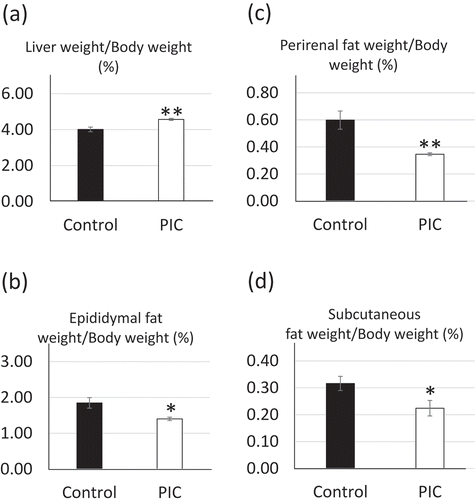
Figure 2. Effects of supplementation of the peels of immature Citrus tumida (PIC) on (a) cumulative liver weight, (b) epididymal fat weight, (c) perirenal fat weight, and (d) subcutaneous fat weight (n = 6–7 in each group).Control: mice with fed AIN93G diet; PIC: mice fed with AIN93G containing 5% PIC (w/w) diet. Data are expressed as mean ± SEM. *P < 0.05, **P < 0.01 versus control.

Table 2. Metabolites affected by ingestion of peels of immature Citrus tumida (Q < 0.1).

Figure 3. Choline-related metabolites in the liver.

The pathway of choline-related metabolites in the liver is shown. Welch’s t-tests were used to compare “supplement,” using both peels of immature Citrus tumida (PIC)-fed mice (n = 4) and control mice (n = 5). Control: mice fed with AIN93G diet; PIC: mice fed with AIN93G containing 5% PIC (w/w) diet. Data are expressed as mean ± SEM.
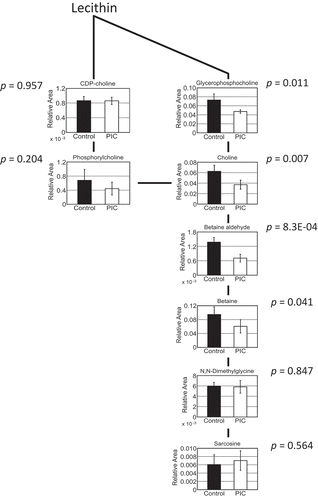
Figure 3. Choline-related metabolites in the liver.The pathway of choline-related metabolites in the liver is shown. Welch’s t-tests were used to compare “supplement,” using both peels of immature Citrus tumida (PIC)-fed mice (n = 4) and control mice (n = 5). Control: mice fed with AIN93G diet; PIC: mice fed with AIN93G containing 5% PIC (w/w) diet. Data are expressed as mean ± SEM.
Supplemental material

Supporting_information.docx

Download MS Word (32 KB)

Supplementary_Table_5..xlsx

Download MS Excel (12.1 KB)

Supplemantary_Table_4-h.xlsx

Download MS Excel (87.6 KB)

Supplementary_Table_3-h.xlsx

Download MS Excel (72 KB)

Data availability statement

The data described in this article are openly available in the Open Science Framework at DOI:10.17605/OSF.IO/TPA6U.

Reprints and Corporate Permissions

Please note: Selecting permissions does not provide access to the full text of the article, please see our help page How do I view content?

To request a reprint or corporate permissions for this article, please click on the relevant link below:

Academic Permissions

Please note: Selecting permissions does not provide access to the full text of the article, please see our help page How do I view content?

Obtain permissions instantly via Rightslink by clicking on the button below:

If you are unable to obtain permissions via Rightslink, please complete and submit this Permissions form. For more information, please visit our Permissions help page.