Figures & data
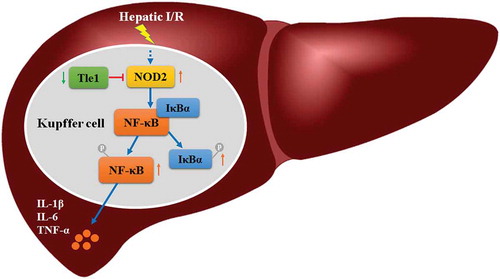
Figure 1. Expression of Tle1, NOD2, and TNF-α in the liver I/R model both in vivo and in vitro.
(a-c) After mice treated with ischemia for 1 h, followed by reperfusion for 1, 3, 6, 9 h, the mRNA levels of NOD2, Tle1, and TNF-α were detected. (d-i) After hypoxia for 6 h and subsequent reoxygenation for 1, 6, 12, 24 h, the mRNA and protein levels of Tle1 and NOD2 as well as the mRNA levels of TNF-α in the cells were measured. *p < 0.05 and **p < 0.01 in comparison to the Sham or Ctrl groups.
Figure 2. Effects of Tle1 in vivo. Mice were subjected to ischemia for 1 h, followed by reperfusion for 6 h.
(a) The mRNA levels of Tle1 in mice treated with PBS, scrambled siRNA, or Tle1-siRNA. (b-c) Serum concentrations of ALT and AST. (d-e) H&E staining of liver tissues (200× magnification) and Suzuki’s scores. (f-h) Serum concentrations of inflammatory agents (IL-6, TNF-α, and IL-1β). *p < 0.05, **p < 0.01 and ***p < 0.001 in comparison to the Sham groups. #p < 0.05 and ##p < 0.01 in comparison to the Scrambled siRNA groups.
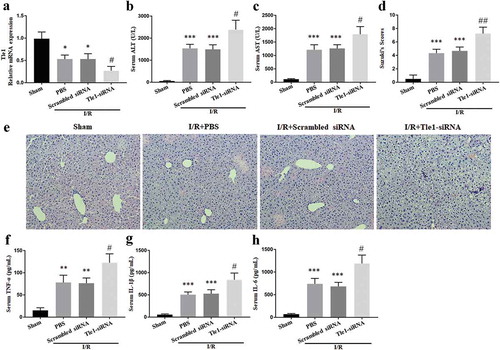
Figure 3. Effects of Tle1 on NOD2 and NF-κB signaling in vitro.
(a-f) The protein levels of Tle1, NOD2, p-p65, p65, p-IκBα, IκBα, and IL-1β. (g-i) Inflammatory agents (IL-6, TNF-α, and IL-1β) in cell supernatant. *p < 0.05, **p < 0.01 and ***p < 0.001 in comparison to the Ctrl groups. #p < 0.05 and ##p < 0.01 in comparison to the Scrambled siRNA groups.
Figure 4. Effects of NOD2 on Tle1 and NF-κB signaling in vitro.
(a-f) The protein levels of Tle1, NOD2, p-p65, p65, p-IκBα, IκBα, and IL-1β. (g-i) Serum levels of IL-6, TNF-α, and IL-1β. **p < 0.01 and ***p < 0.001 in comparison to the Ctrl groups. n.s. p > 0.05, #p < 0.05 and ##p < 0.01 in comparison to the Scrambled siRNA groups.