Figures & data
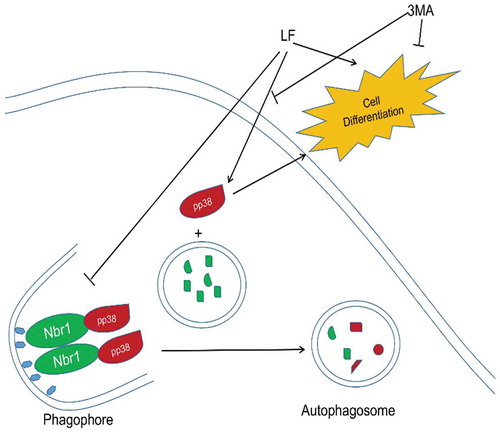
Figure 1. MC3T3-E1 cells viability examination in different LF concentrations treated groups.
CCK-8 assay was employed to test the viability of the MC3T3-E1 cells in different LF concentrations treated groups at 24 h, 48 h, and 72 h.
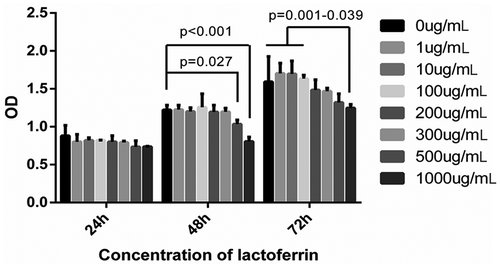
Figure 2. Effect of lactoferrin on preosteoblasts differentiation.
(a) Effect of lactoferrin on ALP activity in Control, 50, 100, 200, and 500ug/mL LF treated groups. MCT3-E1 cells were cultured with different LF concentrations for 24 h. (b) Protein expression of PINP (bone formation marker) and LF in the cell-culture medium were measured with ELISA kit at 7 h and 24 h after LF treatments. (c) Western blot analysis of osteoblastic differentiation-related Runx-2 protein expression in different LF treated groups (Control, 100, 200, and 500ug/mL LF treated group). GAPDH was used as an internal control.
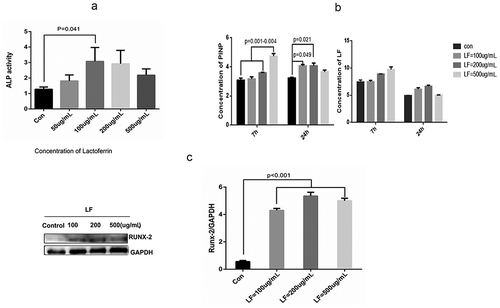
Figure 3. The role of autophagic flux in lactoferrin induced MCT3-E1 cells preosteoblasts.
(a) Western blot analysis of autophagy-related protein expressions(LC3 I, LC3 II, P62) at 24 h and 72 h after different LF dosages treatments. GAPDH was used as an internal control. (b) Immunofluorescence analysis of autolysosome related LC3 expression with Ad-GFP-mRFP-LC. GFP-LC3 and mRFP are green puncta and red puncta, respectively. Scale bar = 100 μm. (c) Scanning electron microscope (SEM) analysis of the autophagosome morphology in control and 100ug/mL lactoferrin treated group. Scale bar = 2 μm.
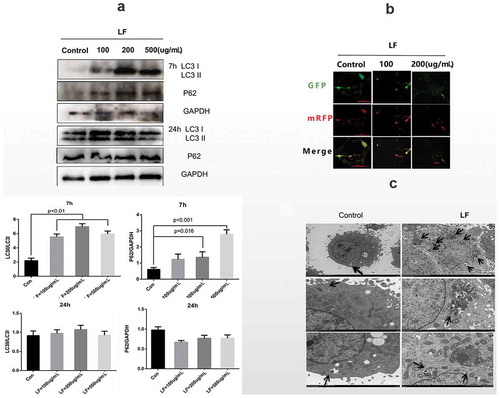
Figure 4. Effect of lactoferrin on preosteoblasts differentiation-related autophagic flux.
(a) MDC staining analysis of autophagosomes and autolysosomes in different treated groups. LF: lactoferrin treatment; 3 MA: autophagy inhibitor 3-MA treatment; 3 MA+LF: lactoferrin and autophagy inhibitor 3-MA treatment; RAPA: autophagy activator rapamycin treatment. Scale bar = 50 μm. (b) Immunofluorescence analysis of preosteoblastic differentiation with Ad-GFP-mRFP-LC3. GFP-LC3 and mRFP are green puncta and red puncta, respectively. Scale bar = 100 μm. (c) Scanning electron microscope (SEM) analysis of the autophagosome morphology of control and 3 MA+LF treated group in MC3T3-E1 cells. Scale bar = 2 μm. (d) ALP activity analysis in five different groups. (e) Protein expression of PINP (bone formation marker) in the cell culture medium was measured with ELISA kit at 7 h and 24 h in five different groups. (f) Alizarin red staining analysis of osteogenesis differentiation in five different groups.
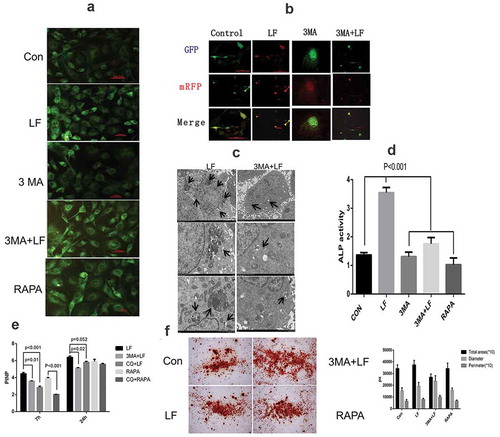
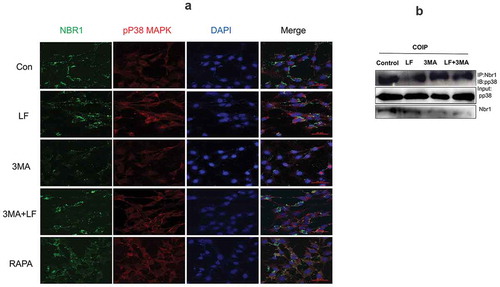
Figure 5. Autophagy related pp38 and Nbr1 protein expression analysis in LF induced preosteoblastic differentiation. (a) Western blot analysis of p38, pp38, and Nbr1 expressions in LF (100ug/mL and 200ug/mL) induced preosteoblastic differentiation. (b) Western blot analysis of p38, pp38, and Nbr1 expressions in LF (100ug/mL and 200ug/mL) induced preosteoblastic differentiation with or without CQ treatment. GAPDH was used as an internal reference.
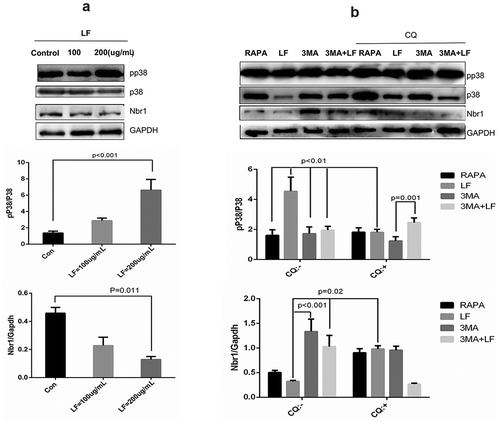
Figure 6. Subcellular distribution and expression of autophagy-related pp38 and Nbr1 in LF induced preosteoblasts differentiation. (a) Immunofluorescence analysis of Alexa Fluor-488 and Alexa Fluor-594 conjugated pp38 and Nbr1 in five different groups. (b) Co-immunoprecipitate analysis of pp38 and Nbr1 in four different groups.