485
Views
8
CrossRef citations to date
0
Altmetric
Food & Nutrition Science

Amazake made from sake cake and rice koji suppresses sebum content in differentiated hamster sebocytes and improves skin properties in humans

ORCID Icon, , , &
Pages 1689-1695 | Received 27 Jan 2020, Accepted 14 Apr 2020, Published online: 21 Apr 2020

Figures & data

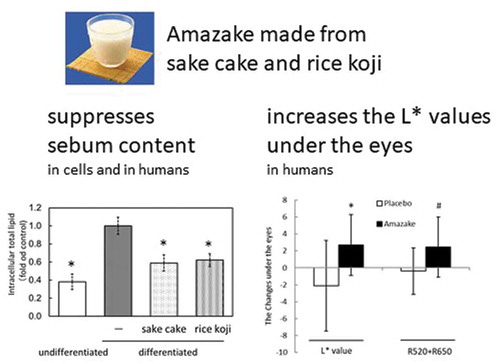
Table 1. Subject background information.

Table 2. Composition of the freeze-dried amazake-like placebo and amazake.

Figure 1. Lipid metabolism assay using hamster sebocytes. Quantification of intracellular total lipids (a), PPARα mRNA (b), and PPARγ mRNA (c). Data are shown as mean ± standard deviation. Intracellular total lipids of undifferentiated or differentiated hamster sebocytes without treatment or treated with sake cake or rice koji were measured using Oil Red O. Relative gene expression of PPARα and PPARγ of undifferentiated or differentiated hamster sebocytes without treatment or treated with sake cake or rice koji were investigated using qRT-PCR. *; P < 0.05, significant difference compared to control differentiated cells (untreated).

Figure 1. Lipid metabolism assay using hamster sebocytes. Quantification of intracellular total lipids (a), PPARα mRNA (b), and PPARγ mRNA (c). Data are shown as mean ± standard deviation. Intracellular total lipids of undifferentiated or differentiated hamster sebocytes without treatment or treated with sake cake or rice koji were measured using Oil Red O. Relative gene expression of PPARα and PPARγ of undifferentiated or differentiated hamster sebocytes without treatment or treated with sake cake or rice koji were investigated using qRT-PCR. *; P < 0.05, significant difference compared to control differentiated cells (untreated).

Figure 2. Skin measurements of the placebo (Placebo) and amazake groups (Amazake). Sebum content (a), skin barrier: transepidermal water loss (b), skin viscoelasticity: R0 (c), R2 (d), R7 (e), skin color: R520+ R650 (f), L* (g), a (h), b (i), and skin temperature (j). Data are shown as mean ± standard deviation. Skin conditions of subjects who ingested placebo or amazake were measured using specialized equipment at 0 and 4 weeks. *; intra-group P < 0.05, significant difference between 0 and 4 weeks. #; inter-group P < 0.05, significant difference between Placebo and Amazake.

Figure 2. Skin measurements of the placebo (Placebo) and amazake groups (Amazake). Sebum content (a), skin barrier: transepidermal water loss (b), skin viscoelasticity: R0 (c), R2 (d), R7 (e), skin color: R520+ R650 (f), L* (g), a (h), b (i), and skin temperature (j). Data are shown as mean ± standard deviation. Skin conditions of subjects who ingested placebo or amazake were measured using specialized equipment at 0 and 4 weeks. *; intra-group P < 0.05, significant difference between 0 and 4 weeks. #; inter-group P < 0.05, significant difference between Placebo and Amazake.

Figure 3. Differences in visual analog scale indices for specified conditions. Data are shown as mean ± standard deviation. Questionnaires were undertaken by subjects who ingested placebo (Placebo) or amazake (Amazake) at 0 and 4 weeks. *; Intra-group P < 0.05, significant difference between 0 and 4 weeks.

Figure 3. Differences in visual analog scale indices for specified conditions. Data are shown as mean ± standard deviation. Questionnaires were undertaken by subjects who ingested placebo (Placebo) or amazake (Amazake) at 0 and 4 weeks. *; Intra-group P < 0.05, significant difference between 0 and 4 weeks.

Figure 4. Intestinal analysis using fecal samples. Data are shown as mean ± standard deviation. Fecal samples were collected from subjects who ingested placebo (Placebo) or amazake (Amazake) at 0 and 4 weeks.

Figure 4. Intestinal analysis using fecal samples. Data are shown as mean ± standard deviation. Fecal samples were collected from subjects who ingested placebo (Placebo) or amazake (Amazake) at 0 and 4 weeks.

Figure 5. Consumption of the freeze-dried amazake resulted in increased L* values and R520+ R650 under the eyes. Data are shown as mean ± standard deviation. *; P < 0.05, and #; P < 0.1, significant difference between the placebo group (placebo) and the amazake group (amazake).

Figure 5. Consumption of the freeze-dried amazake resulted in increased L* values and R520+ R650 under the eyes. Data are shown as mean ± standard deviation. *; P < 0.05, and #; P < 0.1, significant difference between the placebo group (placebo) and the amazake group (amazake).
Supplemental material

Supplemental_Table1_200079_YT.docx

Download MS Word (23.8 KB)

Reprints and Corporate Permissions

Please note: Selecting permissions does not provide access to the full text of the article, please see our help page How do I view content?

To request a reprint or corporate permissions for this article, please click on the relevant link below:

Academic Permissions

Please note: Selecting permissions does not provide access to the full text of the article, please see our help page How do I view content?

Obtain permissions instantly via Rightslink by clicking on the button below:

If you are unable to obtain permissions via Rightslink, please complete and submit this Permissions form. For more information, please visit our Permissions help page.